Here’s a quick quiz for you…
The more times support and resistance is tested (within a short period of time), the stronger it becomes. (True / False)
You should set your stop loss below support and above resistance so you don’t get stopped out easily. (True / False)
You want to buy near support because it offers a favorable risk to reward on your trade. (True / False)
Do you want to know the answers to these questions?
Then read on…
The more times support and resistance are tested within a short period, the weaker they become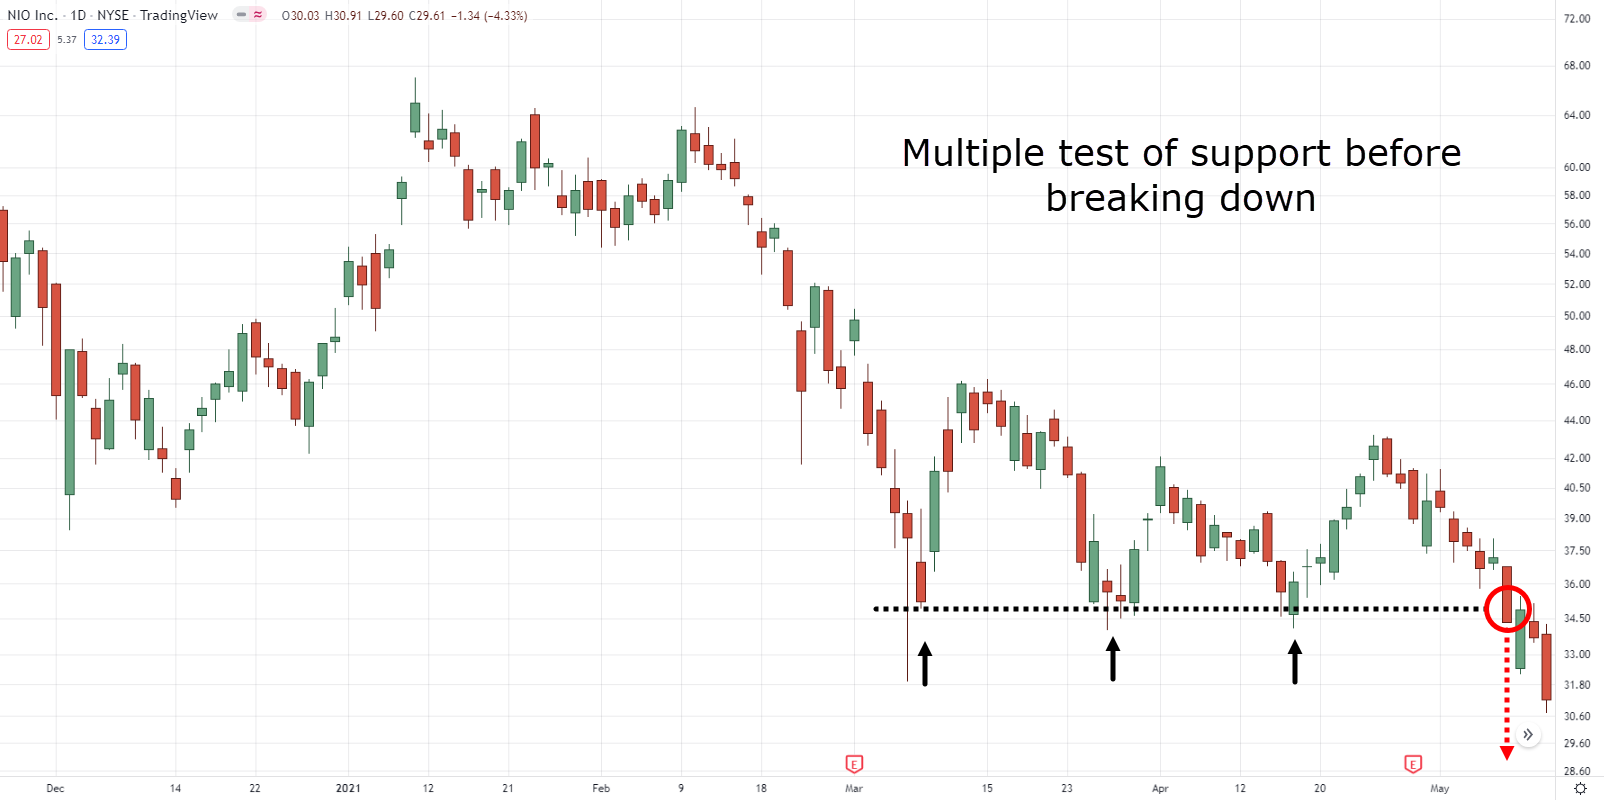
If you read most trading textbooks, they’ll tell you that the more times support and resistance are tested, the stronger they become.
But that’s not true, because the more times support and resistance are tested within a short period, the weaker they become.
Here’s why…
Support exists because there’s potential buying pressure around a certain price level.
(This buying pressure could be institutional orders, retail orders, the smart money, etc.)
So what happens when the price re-tests support multiple times?
Well, these orders start to fill up.
Eventually, when all these orders are filled up, there’s no one left to buy and that’s when support breaks.
This means the more times support and resistance is tested (especially within a short period), the weaker it becomes.
Why a short period?
Because it’s unlikely new orders will be “replenished” so quickly.
Multi-year high is a significant level to pay attention to
Here are a few reasons why…
#1: Losing traders hoping to get out at breakeven
Multi-year highs represent extreme optimism in the markets because most traders (and investors) are in profits.
But as you know, the price cannot go up forever. Eventually, it has to retrace or reverse altogether.
When that happens, many traders will exit their long trades.
However, not everyone will do the same. Some will continue holding, hoping the price could breakout higher to give them even more profits.
But when the market collapses even lower, they’ll regret not selling earlier as their open profits have been eroded and they are now sitting on their losses. They hope the market could re-test the highs so they can get out of their trades at breakeven.
#2: Bearish traders looking to short the markets
For bearish traders, multi-year highs present an opportunity to short the market at a “high price” because they can reference the highs to set their stop loss.
So as the price approaches multi-year highs, the short interest from bearish traders will increase.
#3: Momentum traders looking to buy breakouts
Momentum traders buy breakouts as the price moves above a certain level. It could be breakouts of a range, swing high, resistance, etc.
But what’s interesting is if the price breaks out of multi-year highs, it’ll attract attention from traders across different timeframes.
That’s because whether you’re a day trader, swing trader, long-term trader, etc. the multi-year highs will be something visible on your timeframe (and charts).
Now, whether you’re bullish or bearish, multi-year high is a significant level for traders.
If you’re bearish, then you can reference it to set your stop loss above the highs.
If you’re bullish, then you can look to buy the breakout and have your stops below the previous multi-year highs (anticipating that it could become previous resistance turned support).
(And vice versa for multi-year low.)
Support and resistance are areas on your chart — not lines
Let me share with you a story…
In my early days of trading, I used to think my support and resistance lines are the best and the market will respect it to the pip.
But it didn’t take me long to realize my support and resistance levels keep getting breached, and I thought it was a breakout.
So I traded the breakout.
The next thing I know, the price quickly made a swift reversal in the opposite direction and I got stopped out.
So, I looked back at my charts and asked myself:
“What the hell went wrong?”
Well, it seems the levels I drew did hold up, albeit not to the exact pip.
And that’s when I had an “Aha!” moment…
I realized support and resistance are not lines, instead, they are areas on my chart. Here’s why…
There are usually two groups of traders in the market:
- FOMO traders
- Cheapo traders
I’ll explain…
Traders with the fear of missing out (FOMO) would enter their trades the moment price comes close to support.
And if there’s enough buying pressure, the market would reverse at that location.
On the other hand, some traders want to get the best possible price (cheapo traders), so they place orders at the lows of support. And if enough traders do it, the market will reverse near the lows of support.
But here’s the thing:
You’ve no idea which group of traders will be in control. Whether it’s FOMO or cheapo traders.
Thus, support and resistance are areas on your chart, not lines.
Support and resistance represent an area of value on your charts (but it’s not the only one)
You might be wondering:
“What’s the difference between price and value?”
Price is what you pay, value is what you get.
For example:
If you go to the supermarket and buy 1 apple for $1, that’s the price you pay.
And the value you get is an apple which you can eat immediately without having to grow apple trees and pluck the fruit yourself.
In other words, the price you pay has to be “cheaper” than the value you get or else, there won’t be a transaction.
Now, what has this got to do with trading?
Well, you can enter your trades at any random price level on the chart but, it doesn’t mean you’ll get value. Just like how you don’t get much value when you pay $50 for an apple.
Now you might be thinking:
How do I find areas of value in trading?
Well, these are areas on your chart where potential buying pressure could step in and push the price higher, like support.
Now, it’s not guaranteed that support will hold, but if it does, then it won’t be long before the price reverses higher and goes back to “fair value”.
(And vice versa for resistance).
But here’s the kicker:
Support and resistance are not the only ways to define the areas of value on your charts.
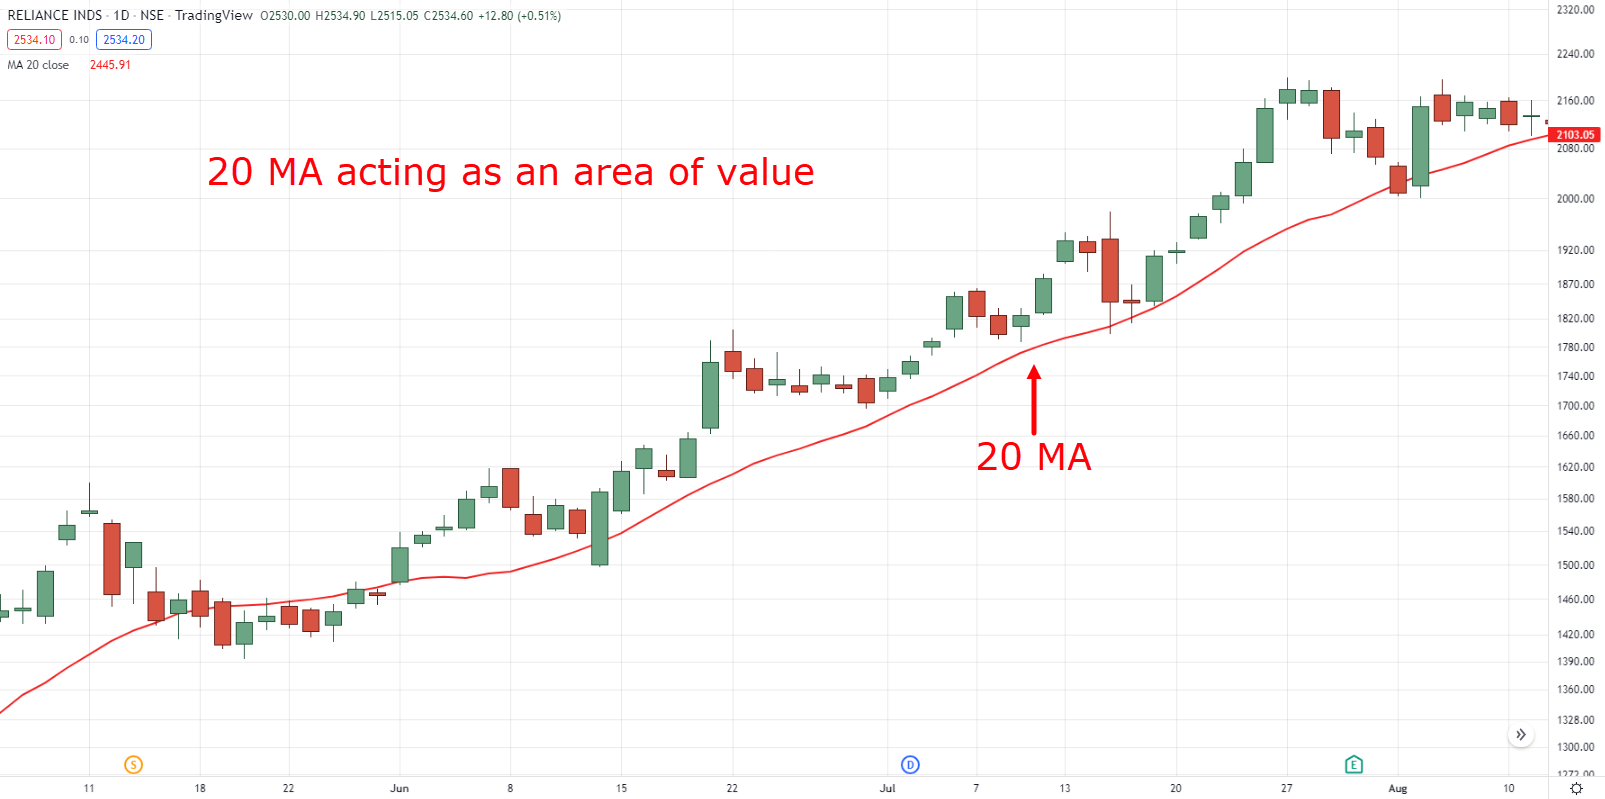
There are other tools like trendlines, moving average, etc.
Here’s what I mean…
If you want to learn more, then check out these trading guides below…
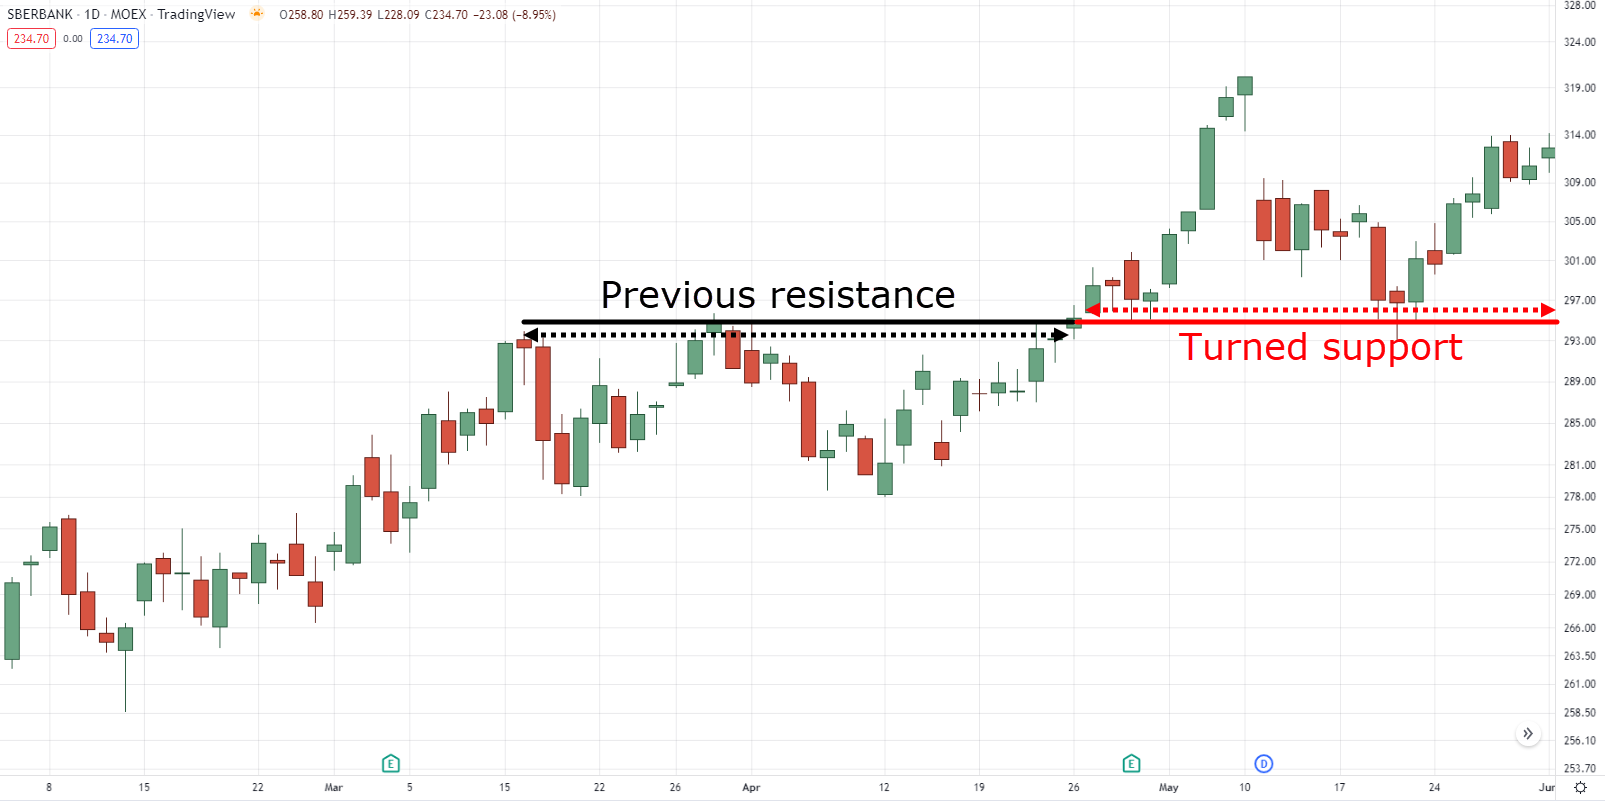
When the price breaks support, it could become as resistance. Here’s why…
There are two reasons for this…
#1: Losing traders hoping to get out at breakeven
Support is an area where potential buying pressure could step in and push the price higher.
However, support doesn’t always hold.
When it breaks, those traders who are long will be sitting in the red. The smart traders will cut their losses and move on. But, stubborn traders will hold onto to their losses and hope the price will reverse back to their entry price — so they can get out at breakeven.
So if you think about it, this group of stubborn traders will create selling pressure at their entry price as they exit their positions, and if there’s enough of such traders, support will become resistance.
But that’s not all because…
#2: Textbook setup
Traders familiar with classical technical analysis will look to sell at the previous area of support as that’s what most textbooks teach.
And if you get enough traders “following” the textbook setup, it puts selling pressure on the previous area of support which could now become resistance.
Here’s an example…
Moving on…
Trading near support and resistance offers favourable risk to reward
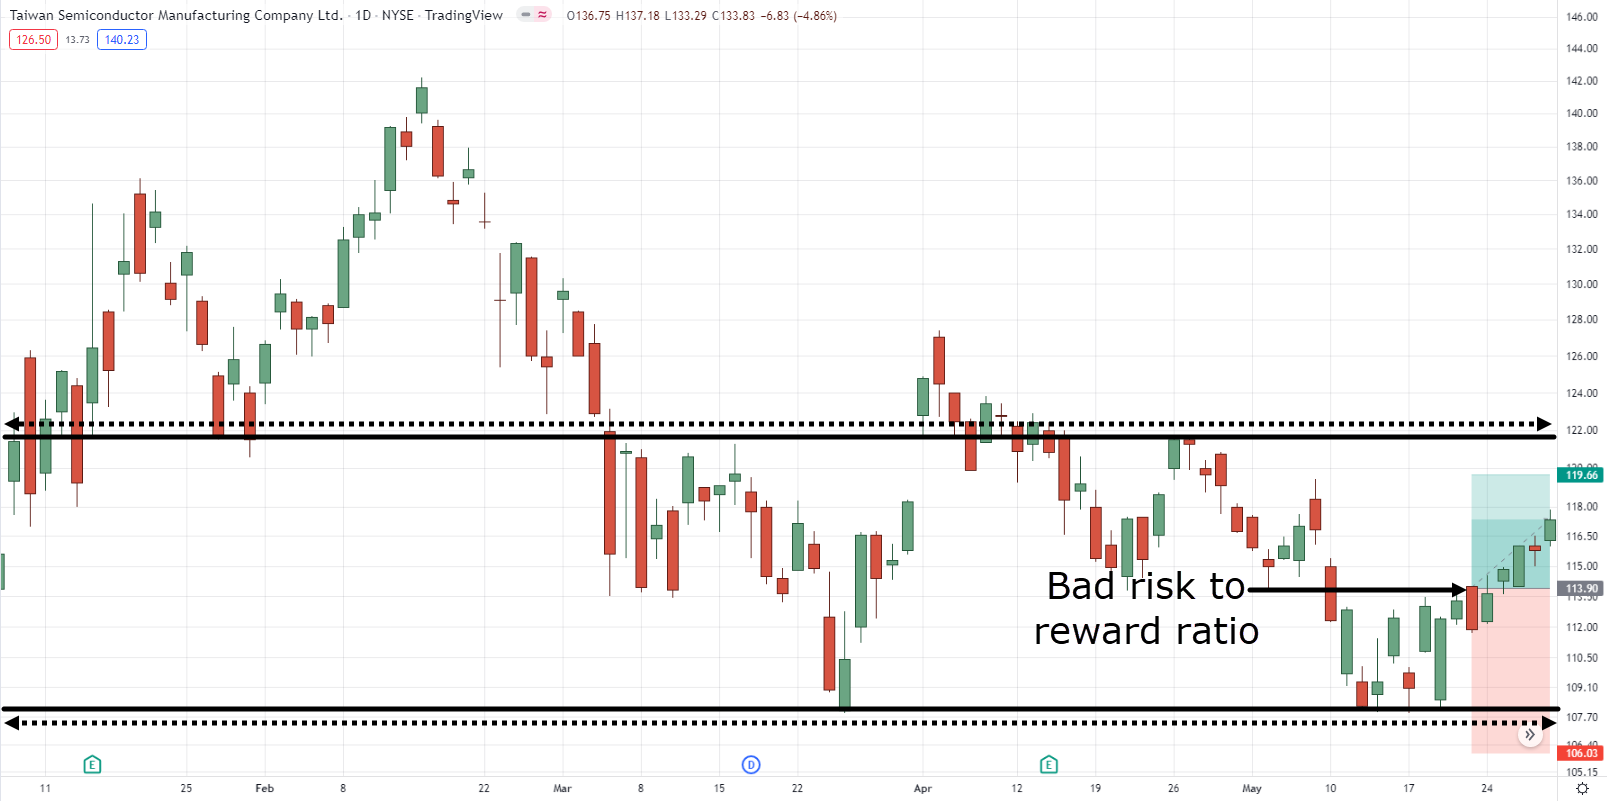
Look at this chart below:
As you can see, the price is far away from support. This means if you want to set a proper stop loss, it has to go below support and it’s far from your entry price.
Next, if you look at the chart, you’ll notice the price approaching a swing high where selling pressure is likely to step in.
So if you use the swing high as your target profit, you can determine your potential risk to reward on the trade which is less than 1 to 1.
So, how can you improve on it?
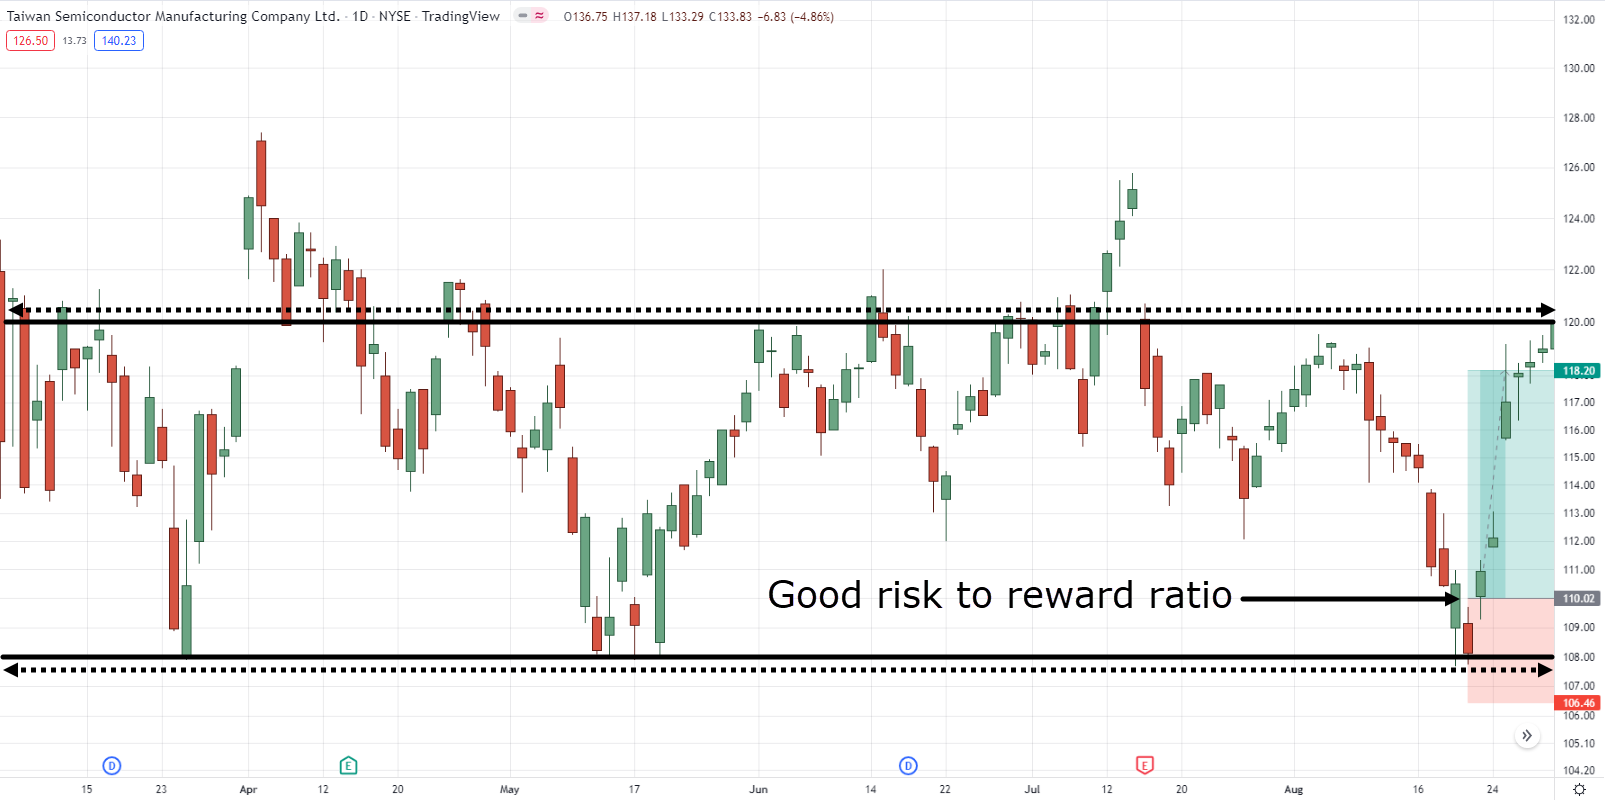
Well, you want to let the price come to you and trade near an area of value (like support and resistance).
Here’s what I mean…
As you can see, the price is much closer to support right now.
Using the same stop loss and target profit as the earlier example, your risk to reward has been dramatically improved.
Can you see how powerful this is?
Same stop loss level. Same target profit. But, with a different trade location — which makes all the difference.
So remember, you want to trade near an area of value, not far from it.
Why your stop loss always gets eaten and how to avoid it
Imagine…
You manage a hedge fund and want to buy 1 million shares of ABC stock. You know support is at $100 and ABC is currently trading at $110.
Now if you were to buy ABC stock right now, you’ll likely push the price higher and get filled at an average price of $115 — that’s $5 higher than the current price.
So what do you do?
Since you know $100 is an area of support, chances are, there will be a cluster of stop loss underneath it (from traders who are long ABC stock).
So, if you could push the price lower to trigger these stops, there would be a flood of sell orders hitting the market (as buyers will exit their losing positions).
With the amount of selling pressure coming in, you could buy your 1 million shares of ABC stock from these traders which gives you a better average price.
In other words, if an institution wants to long the markets with minimal slippage, they tend to place a sell order to trigger nearby stop losses. This allows them to buy from traders cutting their losses, which offers them a more favourable entry price.
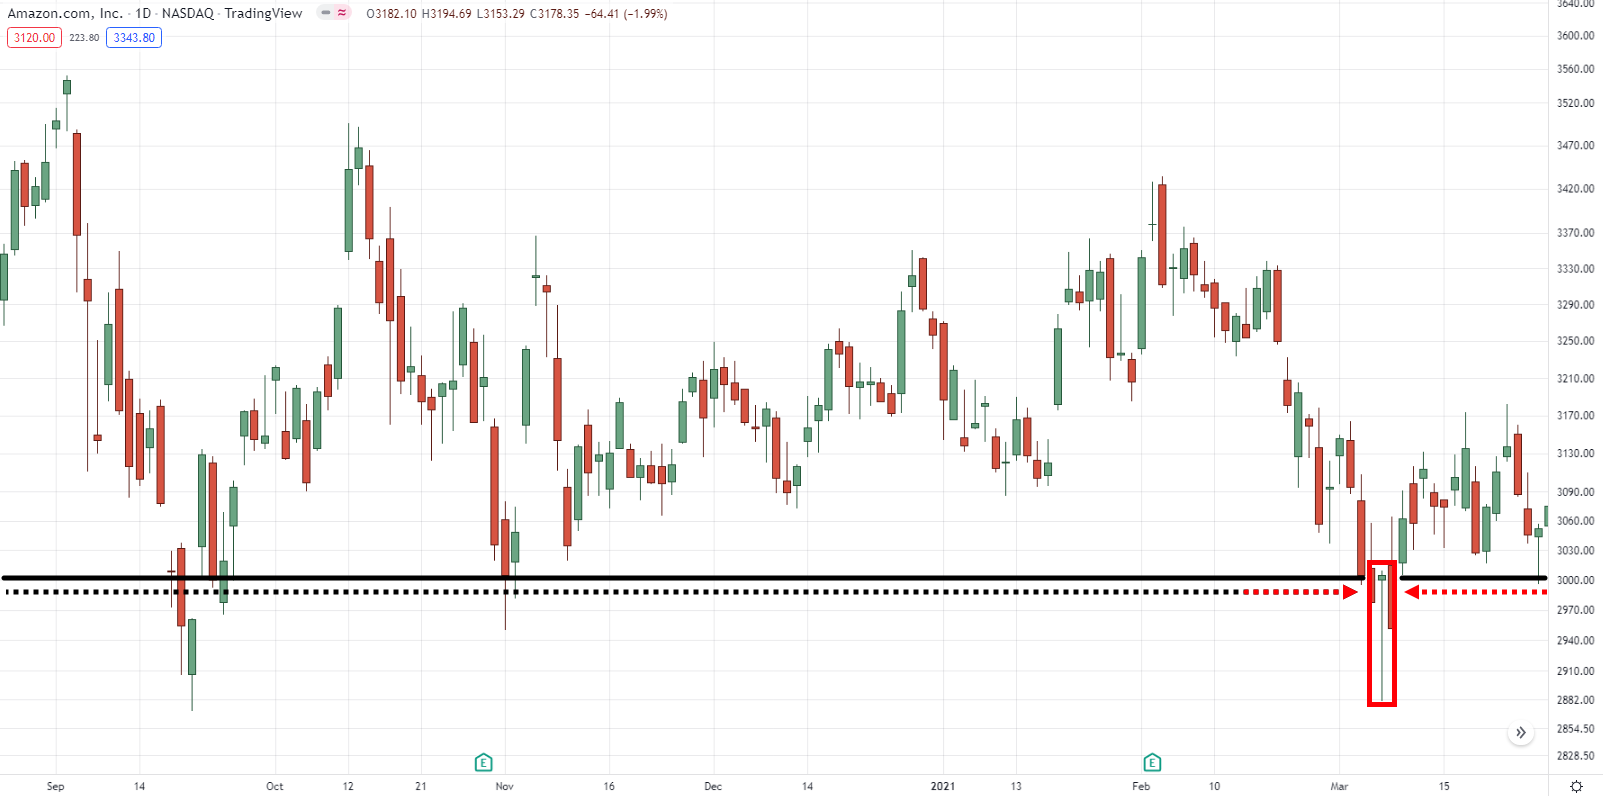
Go look at your charts and you’ll often see the market taking out the lows of support, only to trade higher subsequently.
An example:
Now you’re probably wondering:
“So how do I avoid it?”
Simple.
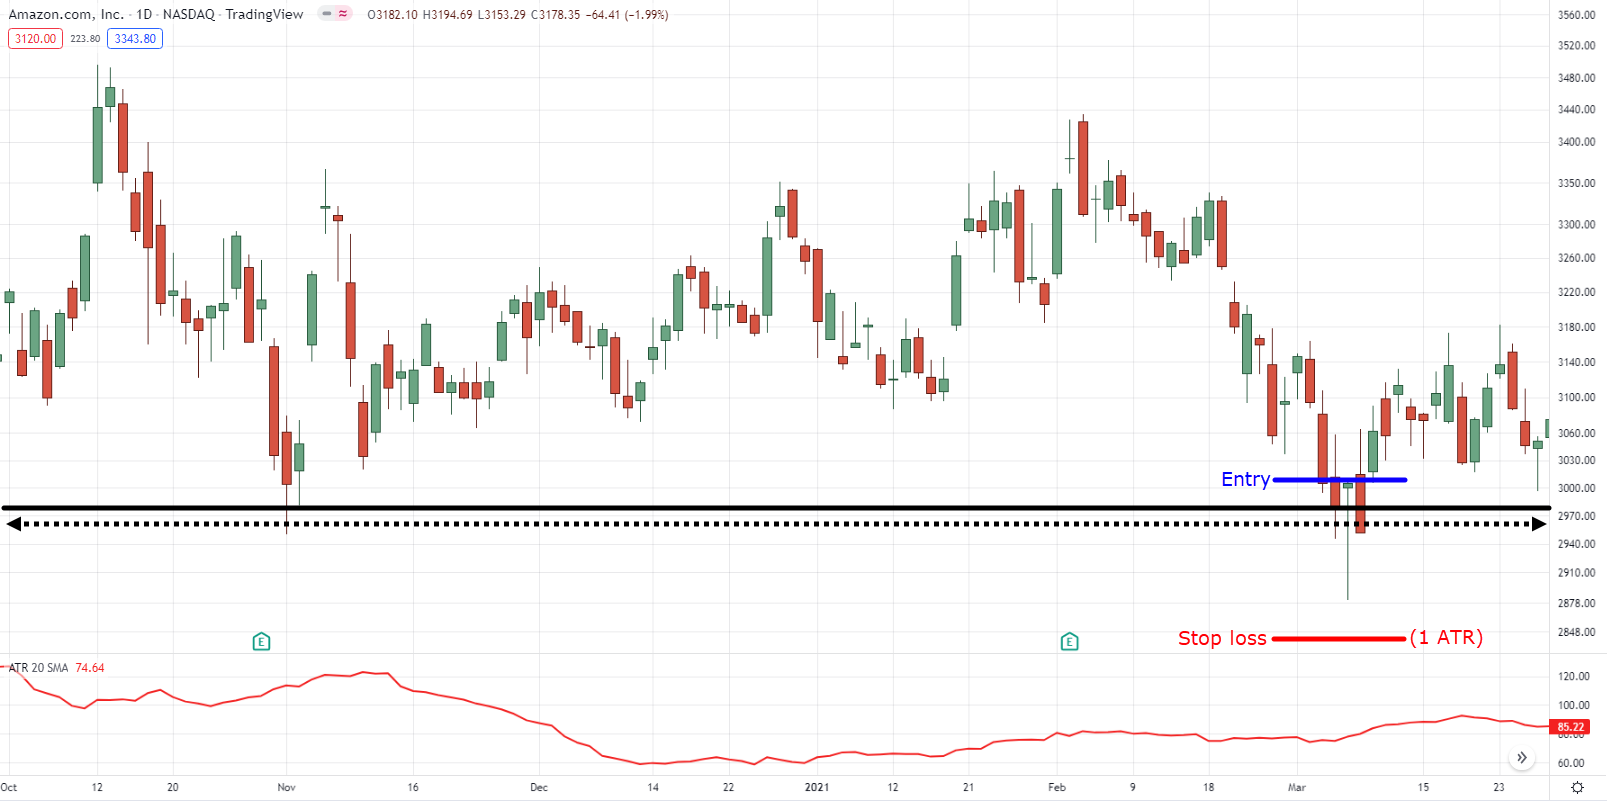
Set your stop loss a distance away from support to give it some buffer so your stop loss doesn’t get eaten too easily.
Here’s how…
- Identify the lows of support
- Find the current Average True Range (ATR) value and subtract 1 ATR from the lows of support
The idea is to define the current market’s volatility and then subtract it from the lows of support.
This way, you are giving your stop loss a buffer that’s based on the volatility of the markets (and not just some random number).
Here’s what I mean…
Pro Tip:
If you want a tighter stop loss, you can reduce your ATR multiple, like having 0.5 ATR instead of 1.
Bonus: How to draw support and resistance like a pro
At this point:
You’ve discovered the truth about support and resistance, and you can’t wait to use this powerful tool in your trading.
But you’re wondering:
“How do I draw support and resistance correctly?”
Here are 3 guidelines to follow:
- Zoom out your charts so you can see the big picture
- Draw the most obvious levels as those tend to have the strongest reaction
- Adjust your levels to get the most number of touches so you can get the “sweet spot”
If you want more details, then check out this training below…
Conclusion
So here’s what you’ve learned today:
- The more times support and resistance are tested in a short period, the weaker they become
- Multi-year high/low is a significant level as it attracts attention from traders across different timeframes
- Support and resistance are areas on your charts, not lines
- Support and resistance are not the only ways to identify the area of value, you can also use tools like trendlines, moving average, etc.
- When support breaks, it could become resistance (and vice versa)
- Trading near support and resistance allows you to have a tighter stop loss which improves your risk to reward
- You want to avoid placing your stop loss just below support because it gets eaten easily. Instead, give it some buffer like 1 ATR below support
Now here’s what I’d like to know…
How do you use support and resistance in your trading?
Leave a comment below and share your thoughts with me.

Nice writing. Need the pdf.
Thank you, Kunal!
Very powerful. I’ll definitely draw my S and R lines differently
Awesome!
What is stopping the institutions from going to 1 ATR where your stoploss is?
1 ATR, 5 ATR, 10 ATR
Doesn’t matter, there will always be chances where your stop loss will get hit.
Whether it’s the institutions, central banks, or even Elon Musk that’s going to “hit” your stop loss.
The real question is, does your system or your method have an edge?
A stop loss is only a small part of the equation my friend!
Nicely elaborate S&P, please give some more light on giving SL by referring ATR.
Hey there Dillip, check this out!
https://www.tradingwithrayner.com/atr-indicator/
I use support to help me enter a buy trade and resistance to help me sell in a trade
Great, thanks for sharing, Eric!
Hi Teo, my name is Eze okechukwu from Nigeria. I have been following your teaching both on YouTube and telegram. I want to know, were is the best place to draw your trendline, support and resistant level? Is it at the wick of candlestick or the body of candlestick?
Hey there Eze, it’s both!
You must consider both the wick and the body of the candlestick.
The trick here is for you to draw a box (and not a line) because support and resistance is an “area” on your chart.
I hope that helps!
Hi Teo , i am following all your videos really helpful for me but while doing practically it’s totally different..how to be patience cos in trading patience is one of the best tool to be follow ..but a new trader like me we fail to follow the patience and become fear and sentiment ..please guide me how to be trade fearless and to be patience …
Hey there Vijay, patience is often tied to expectations in the market and with the lack of confidence with the strategy you are using!
Both patience, confidence, and edge takes time to acquire and never instantly.
So, I suggest you push on, add more objectivity to your rules and less subjectivity!
First of all Support and resistance are area not line and second when you trade at support and resistance it gives you area of value and better risk to reward and support and resistance can be trade by drowning area,trend line, moving average etc
You said it right, Niraj!
Wow good
Thank you, Sopuruchukwu!
Thanks boss 🙏🥰
You’re welcome, Ola!
Nice👍 Thank you
You’re welcome, Royston!
Everytime I visit your videos and teachings I learn a new. Thank you 😊
Great to hear that Melore!
You’re welcome!