In 1983, two commodity traders, Richard Dennis and William Eckhardt experimented to see if trading is an inborn skill or it can be taught.
So they conducted interviews to find people who were the right fit.
A few lucky candidates were selected for the program—they were known as the turtle traders.
Next, Richard Dennis gave the turtle traders a fixed set of trading rules to trade the markets (using his money).
The result?
It was astonishing! Several turtle traders made triple-digit returns within a few short years and some even went on the set up their own hedge funds.
Clearly, the turtle trading rules worked well in the 1980s.
But the question is:
Do the turtle trading rules still work today?
Well, that’s what you’re about to discover in this post.
So let’s get started…
Turtle trading strategy: The original rules and results
Turtle trading is basically a trend following strategy for the futures market.
Here are the rules of the turtle trading strategy:
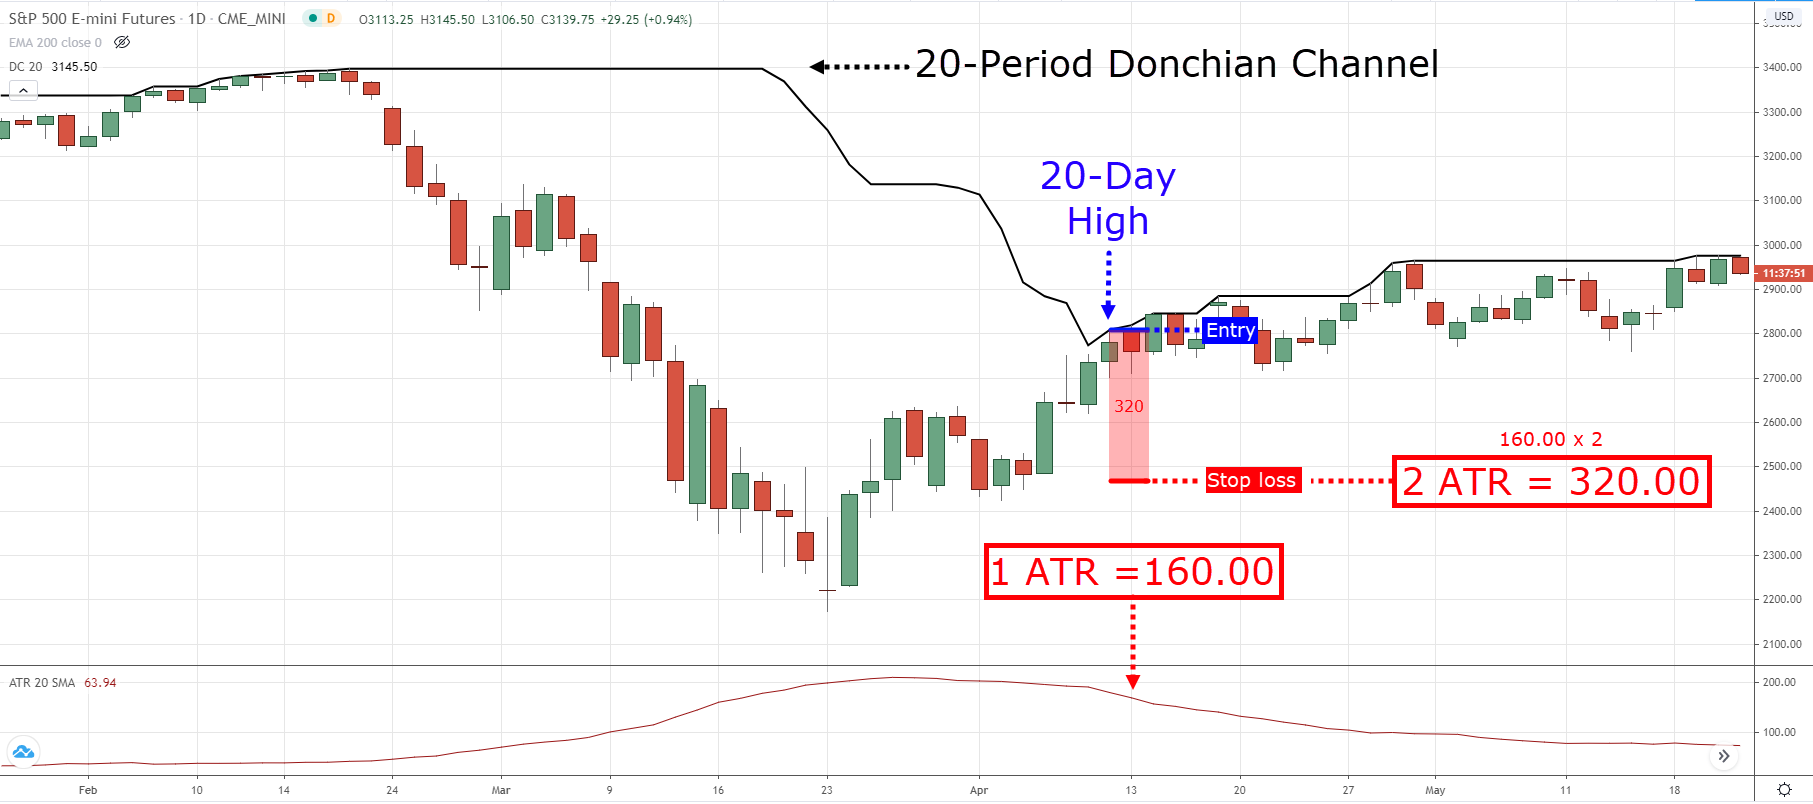
- Entry: Buy when the price breaks above the 20-day high
- Stop loss: 2 ATR from the entry price
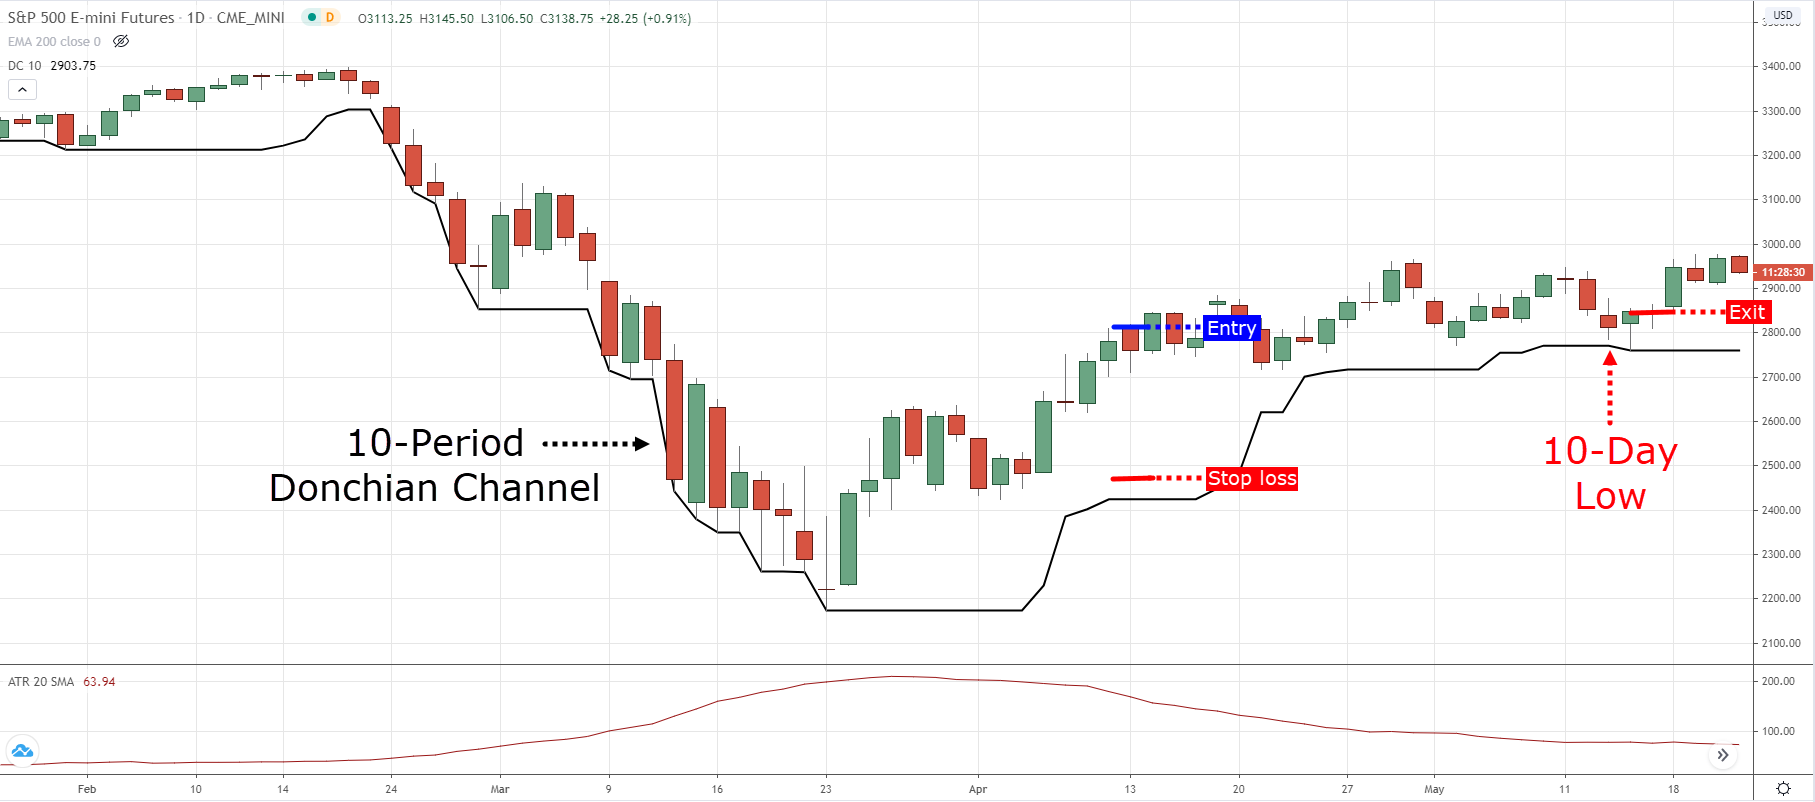
- Trailing stop loss: 10-day low
- Risk management: 2% of your account
- Vice versa for short trades
Markets traded:
- Bonds & Interest Rates: 30-Year US Treasury Bond, 10-Year US Treasury Bond, Eurodollar, 90-Day US Treasury Bill
- Commodities: Coffee, Cocoa, Sugar, Cotton, Gold, Silver, Copper
- Energy: Crude Oil, Heating Oil, Unleaded Gas
- Currencies: Swiss Franc, Deutschmark, British Pound, French Franc, Japanese Yen, Canadian Dollar
Note: The original turtle trading rules are a little more complex as it trades both a long-term and short-term breakout. Also, it scales into winners as the price moves in your favour.
(If you want the exact trading rules, then check this out.)
Other parameters:
- Transaction cost: $10 per trade
- Execution: Market open
- Test period: 2000 – 2019
Here’s an example of the trading setup:
Now…
To run this backtest, I’ll keep things simple and trade only the short-term breakout and without scaling in.
Also, some of the markets no longer exist (like Deutschmark, French Franc) so we will exclude these markets.
Results of the turtle trading rules
- Number of trades: 4322
- Winning rate: 36.83%
- Annual return: -0.38%
- Maximum drawdown: -95.38%
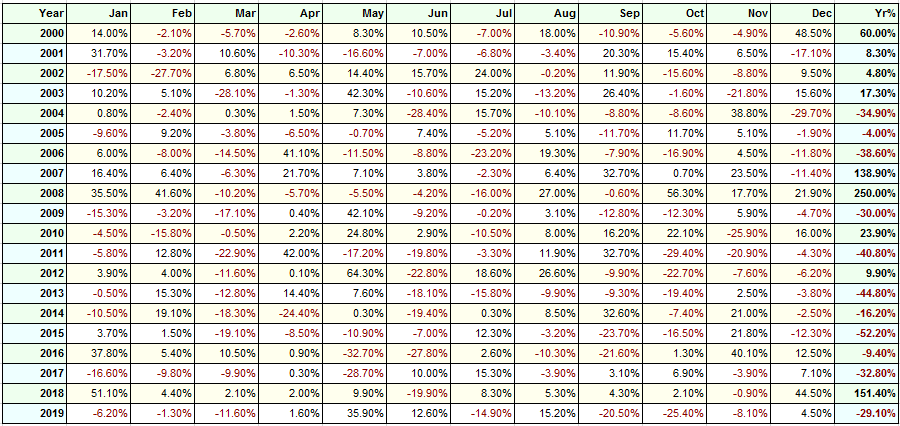
And here’s the full breakdown over the last 20 years…
Clearly, we can agree the turtle trading strategy isn’t doing well over the last 20 years.
Now you’re probably thinking…
“Does it mean the turtle trading rules have stopped working?”
Well, the answer is yes and no.
Yes, you can say the original turtle trading rules have stopped working given the poor trading results you just saw.
However, does it mean that trend following is dead?
To answer that question, let’s first understand the principles of trend following…
- Buy high and sell higher (sell low and cover lower)
- Risk a fraction of your capital on each trade
- Trade a variety of markets from different sectors (as many as possible)
- Trail your stop loss to ride the trend
- Don’t predict, react
Now, if you take the turtle trading rules and compare it to the principles of trend following, you’ll notice there are a few things we can improve on.
For example, you can increase the number of markets to trade, reduce your risk per trade, and increase the length of the breakout (to reduce whipsaw).
So, let’s modify our earlier turtle trading rules and see if we can make things better…
Modified turtle trading rules and results
- Entry: Buy when the price breaks above the 200-day high (previously was 20-day breakout)
- Stop loss: 2 ATR from the entry price
- Trailing stop loss: 10-day low
- Risk management: 1% of your account (previously was 2%)
- Vice versa for short trades
Markets traded:
Agriculture: Feeder Cattle, Rough Rice, Sugar, Coffee, Soybean, Soybean Meal, Soybean Oil, Wheat, Corn, Lumber
Bonds: 30-year T Bond, 5-year T Note, Buxl, Bund, Bobl, BTP, Gilt, Canada Bond
Currencies: EUR/USD, GBP/USD, AUD/USD, NZD/USD, USD/MXN, USD/ZAR, USD/INR, USD/RUB, USD/CNH, USD/JPY
Indices: S&P 500, Nasdaq, Euro Stoxx, CAC 40, S&P/TSX 60, Nikkei, Hang Seng, China A50
Non-agriculture: Brent Crude Oil, Gasoline, Heating Oil, Natural Gas, Gold, Silver, Palladium, Platinum, Copper
Results of modified turtle trading rules
- Number of trades: 2957
- Winning rate: 40.95%
- Annual return: 32.12%
- Maximum drawdown: -41.51%
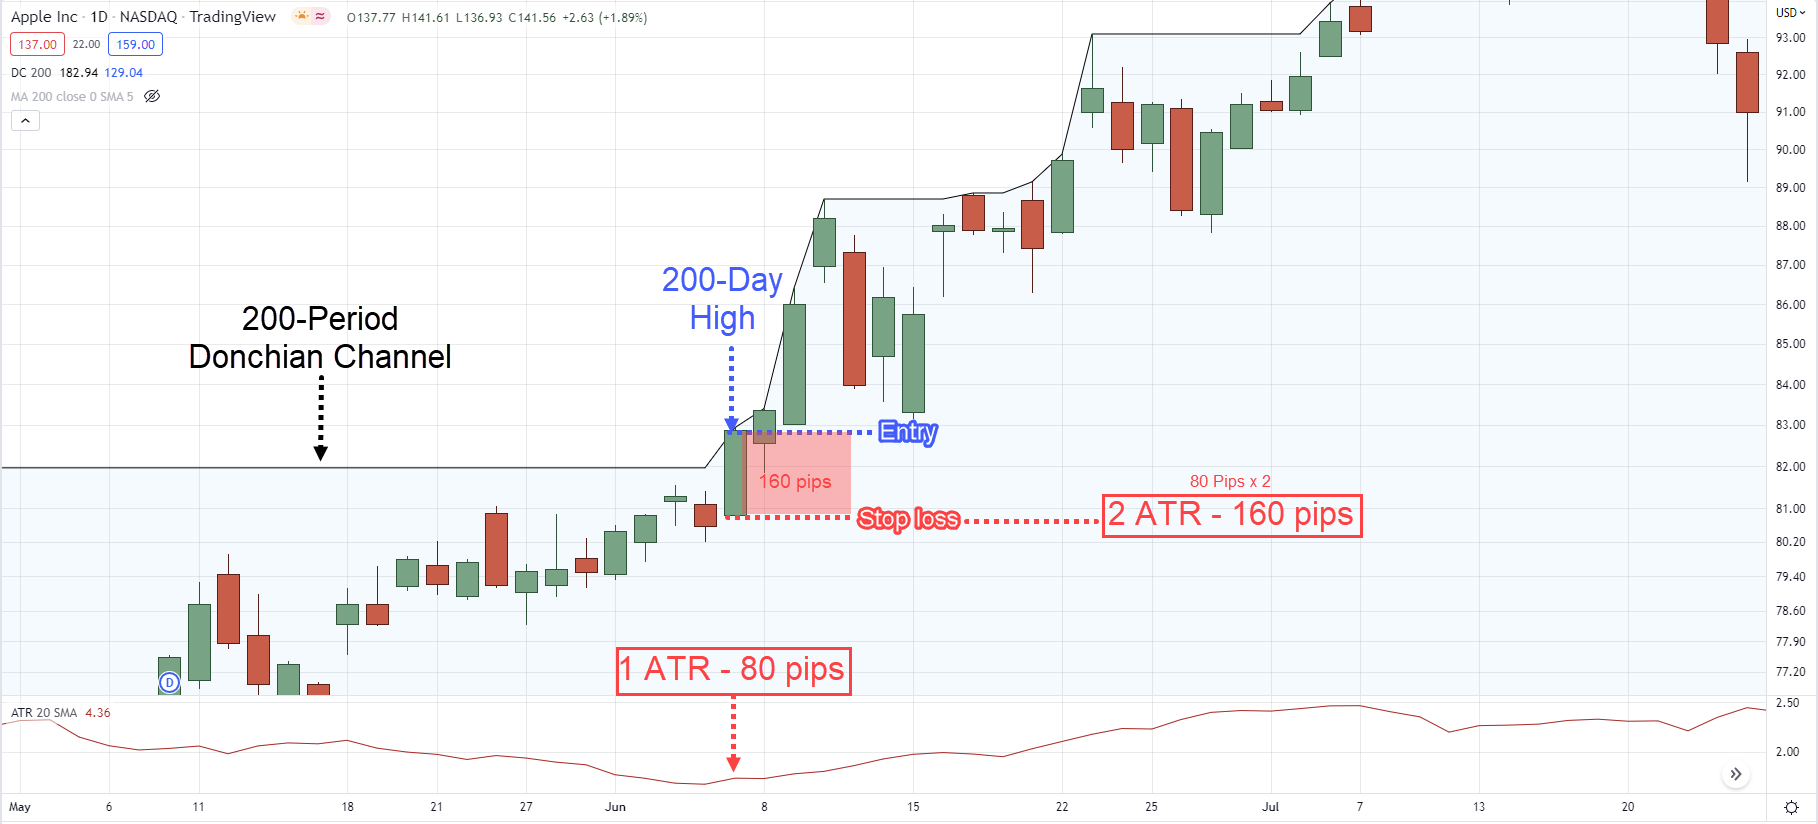
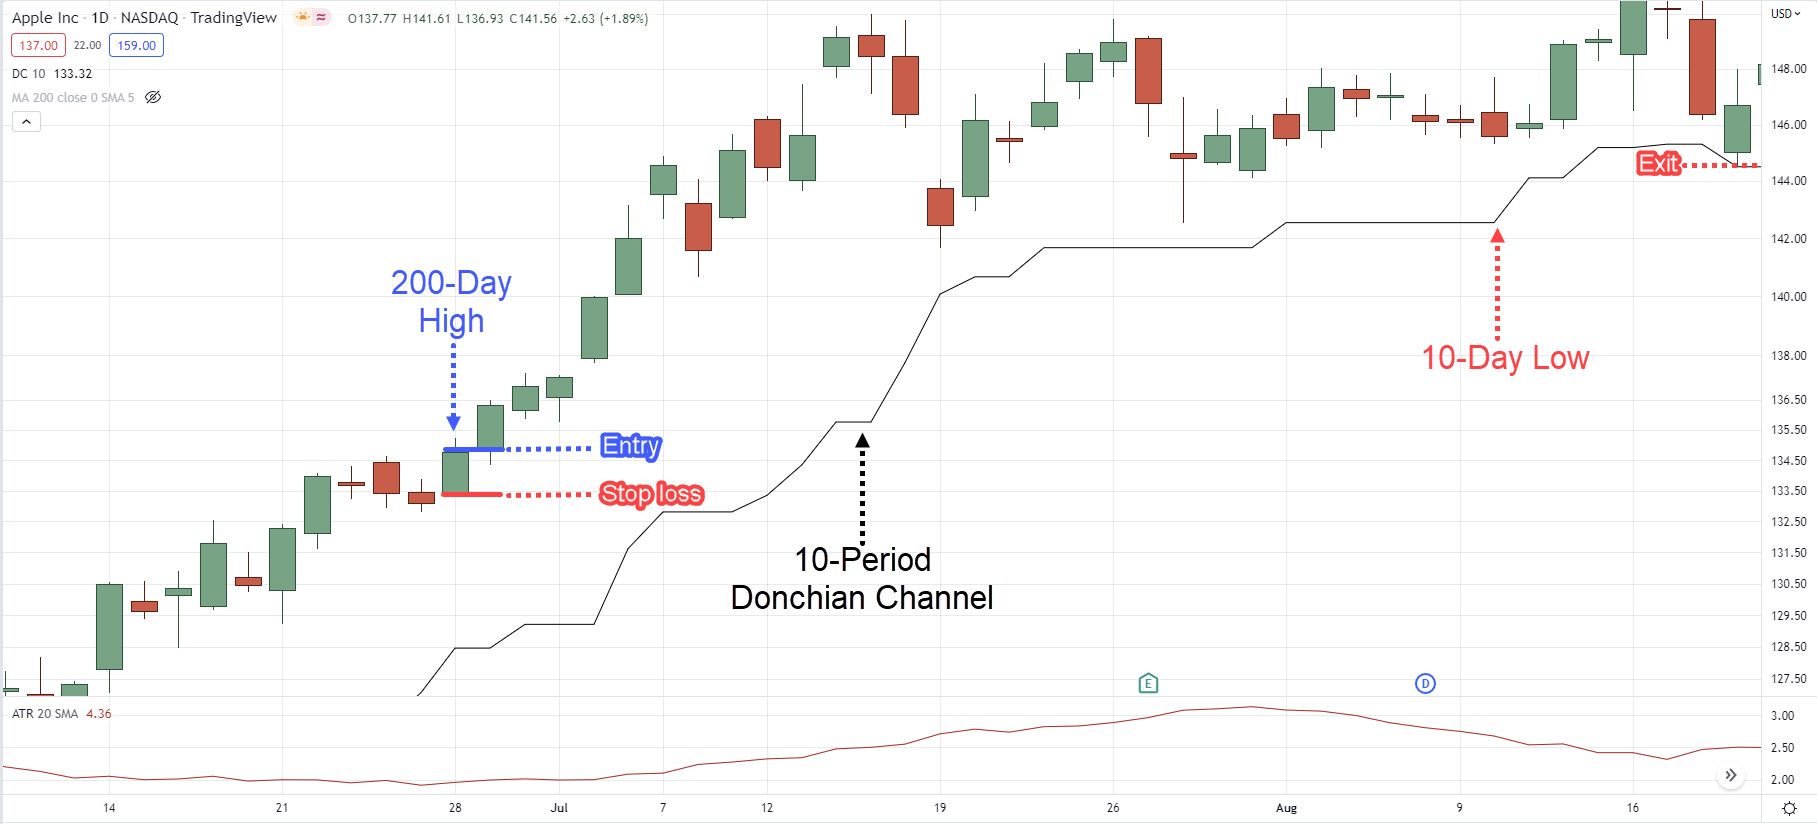
Here’s an example of the trading setup:
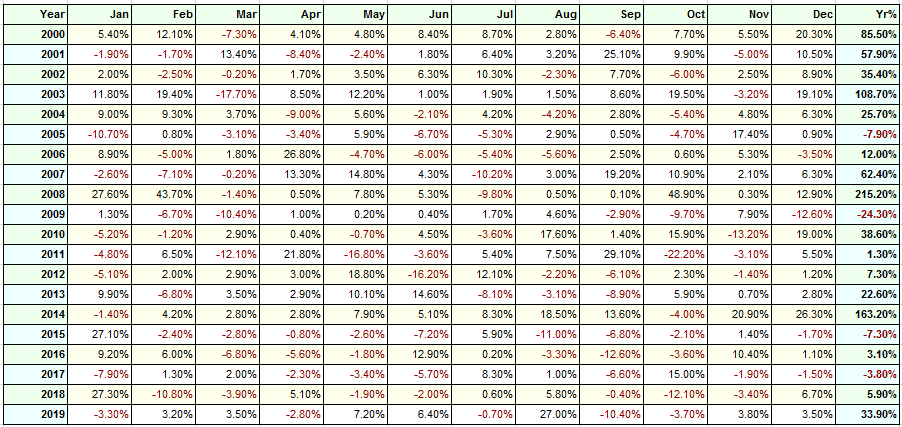
And here’s the full breakdown over the last 20 years…
As you can see, the results have dramatically improved.
Now you might be thinking…
“How do I know if you’re not curve-fitting the results?”
That’s a good question.
So, let’s test the robustness of the modified turtle trading rules using different breakout entry.
Here are the results of trading a 189-day breakout:
- Annual return: 31%
- Maximum drawdown: 44.51%
Here are the results of trading a 227-day breakout:
- Annual return: 32.12%
- Maximum drawdown: 41.51%
Clearly, both variants of the breakout entry still yield a positive expectancy.
So, what can you learn from this turtle trading “experiment”?
3 important lessons you can learn from the turtle trading strategy
Based on the data you’ve seen, the original turtle trading rules don’t work anymore. However, the principles behind it still work.
So here’s the takeaway…
#1: Understand the concept behind your trading strategy
You must understand the logic and concept behind your trading strategy because that’s what powers your trading strategy (like how an engine powers a car).
And if you understand the concept behind it, you can develop multiple trading strategies around it and diversify your risk.
But without an understanding of it, you’ll abandon the trading strategy when the drawdown comes—and you’ll have no idea how to fix it.
#2: Manage your risk
Now you might have a winning trading strategy, but without proper risk management, you’ll still blow up your trading account.
Here’s the proof…
Earlier, the modified turtle trading strategy produced an annual return of 32.12% and a maximum drawdown of 41.51%, with a 1% risk per trade.
Now, what if we increased our risk to 4%?
Well, you’ll get an annual return of 75.84% and a maximum drawdown of 96.82%. In other words, you blew up because it’s near impossible to recover from a 96% drawdown.
Moral of the story?
A trading strategy is useless without proper risk management.
#3: Adapt to changing market conditions
Here’s the thing:
Market conditions change. This means a trading strategy won’t work all the time and it’ll go through a period of drawdown.
However, there are times when a trading strategy stops working altogether (like the turtle trading strategy).
So what now?
Well, here’s what you can do…
#1: Find out if it’s the trading concept that fails or the trading strategy. Because if it’s the trading strategy, then you can tweak it and improve on things.
#2: But if the concept has stopped working, then save your time and move onto another trading concept.
#3: Develop trading strategies around the new concept that you’ve learned.
Conclusion
The original turtle trading rules don’t work anymore.
But it doesn’t mean that trend following is dead, because with a few tweaks, we managed to develop a sound trend following strategy.
The key thing is to focus on the trading concept and not blindly follow a trading strategy. Because once you understand the concept, you can build multiple trading strategies from it.
Now here’s what I’d like to know…
What are your thoughts on the turtle trading strategy?
Leave a comment below and share your thoughts with me.

Trend Strategies can still work. A few tweaks, like adding key moving avg’s can make a difference ( i.e. buy a 10 week b/ o if above a 10 and 30 week ma). Also, longer term strategies tend to have fewer false B/O’s. I read where Ed Seykota uses B/O’s from very long term MA’s and still generates big annual returns.