I know you’re excited to learn about the shooting stocks trading strategy.
But before we get into the details, you must understand why a trading strategy works so you’ll have the conviction to trade (and not abandon it after a few losing trades).
So, let’s kick things off by understanding the concept behind shooting stocks strategy and why it works…What is shooting stocks strategy and why does it work?
The shooting stocks strategy looks to buy strong momentum stocks and ride it till it ends (which is similar to Trend Following).
The idea behind this is that stocks that performed well over the last 6 – 12 months tend to outperform the market.
This could be due to behavioural bias where traders think the price will continue higher based on recent price increase, a fundamental catalyst that pushes the stock price higher (like new product), etc.
Now, this isn’t some “theory” I came up with because there are academic researches that backed up these findings.
For example:
A Century of Trend Following Investing – Hurst, Ooi, Pendersen
Two Centuries of Multi-Asset Momentum – Geczy, Samanov
Returns to Buying Winners and Selling Losers – Jegadeesh and Titman
Of course, just because someone says a trading strategy works doesn’t mean you go and trade it immediately because they could be wrong.
That’s why it’s important to test and verify it for yourself — which is what we’ll cover next…Does momentum work in the stock markets? Let’s find out…
Using the concepts I discussed earlier, let’s transform it into a systematic strategy which we can run a backtest on.
Note: I’ve gotten this trading system from the book Weekend Trend Trader by Nick Radge, and modified it slightly. So, credits go to him.
Here are the rules of the trading strategy…
Trend filter:
- Buy only if the Russell 3000 index is above the 100-week Moving Average (or else stay in cash)
Trading rules:
- Go long when a stock hits a 50-week high (if there are too many stocks to choose, select the top 20 that have the largest price increase over the last 50-weeks)
- Have a 20% trailing stop loss
- Maximum of 20 stocks with 5% of capital allocated to each stock
Markets traded:
- Russell 1000 stocks
The results:
- Number of trades: 905
- Winning rate: 49.17%
- Annual return: 15.70%
- Maximum drawdown: 35.08%
And here’s the performance breakdown on a month-on-month basis…
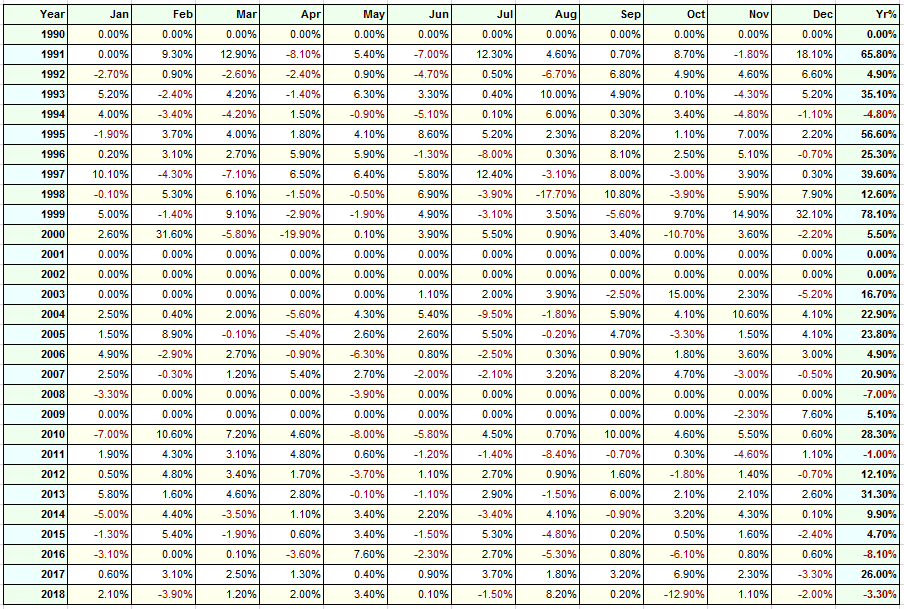
As you can see, momentum trading beats a buy-and-hold approach as it offers greater returns with a lower level of drawdown.
Now:
If you’re someone who prefers a systematic trading approach, then you can adopt this framework and use it to trade the stock markets.
But, if you lean more towards discretionary trading, then you can use the concepts I’ve shared earlier and overlay it with classical chart patterns so you can better time your entries and manage your risk.
And this is what The Shooting Stocks Strategy is all about…
Interested?
Then read on…
Shooting Stocks Strategy: Setup
Unlike the backtest example which buys a stock when it hits the 50-week high, our Shooting Stocks Strategy will be more selective with our entries.
What you’re looking for is a volatility contraction to occur before the breakout. This could be in the form of a bull flag pattern, ascending triangle, or a breakout with a buildup.
Here’s why…
#1: The market moves in volatility cycles, from a period of low volatility to high volatility and vice versa. So, when you buy during a low volatility period, there’s a good chance that volatility could expand in your favour which offers attractive risk to reward.
#2: By waiting for a volatility contraction pattern to occur, you can better define your risk by having your stop loss placed below the recent swing lows. From there, you can calculate the number of shares to buy based on the % risk of your trading capital.
Now besides the entry and exit, everything else remains the same. This means you'll use an index trend filter (100-week MA) and focus on stocks which have increased the most in price over the last 50-weeks.
Next, let me share with you a few examples of The Shooting Stocks Strategy…Trading setups
1. Shopify Daily Timeframe
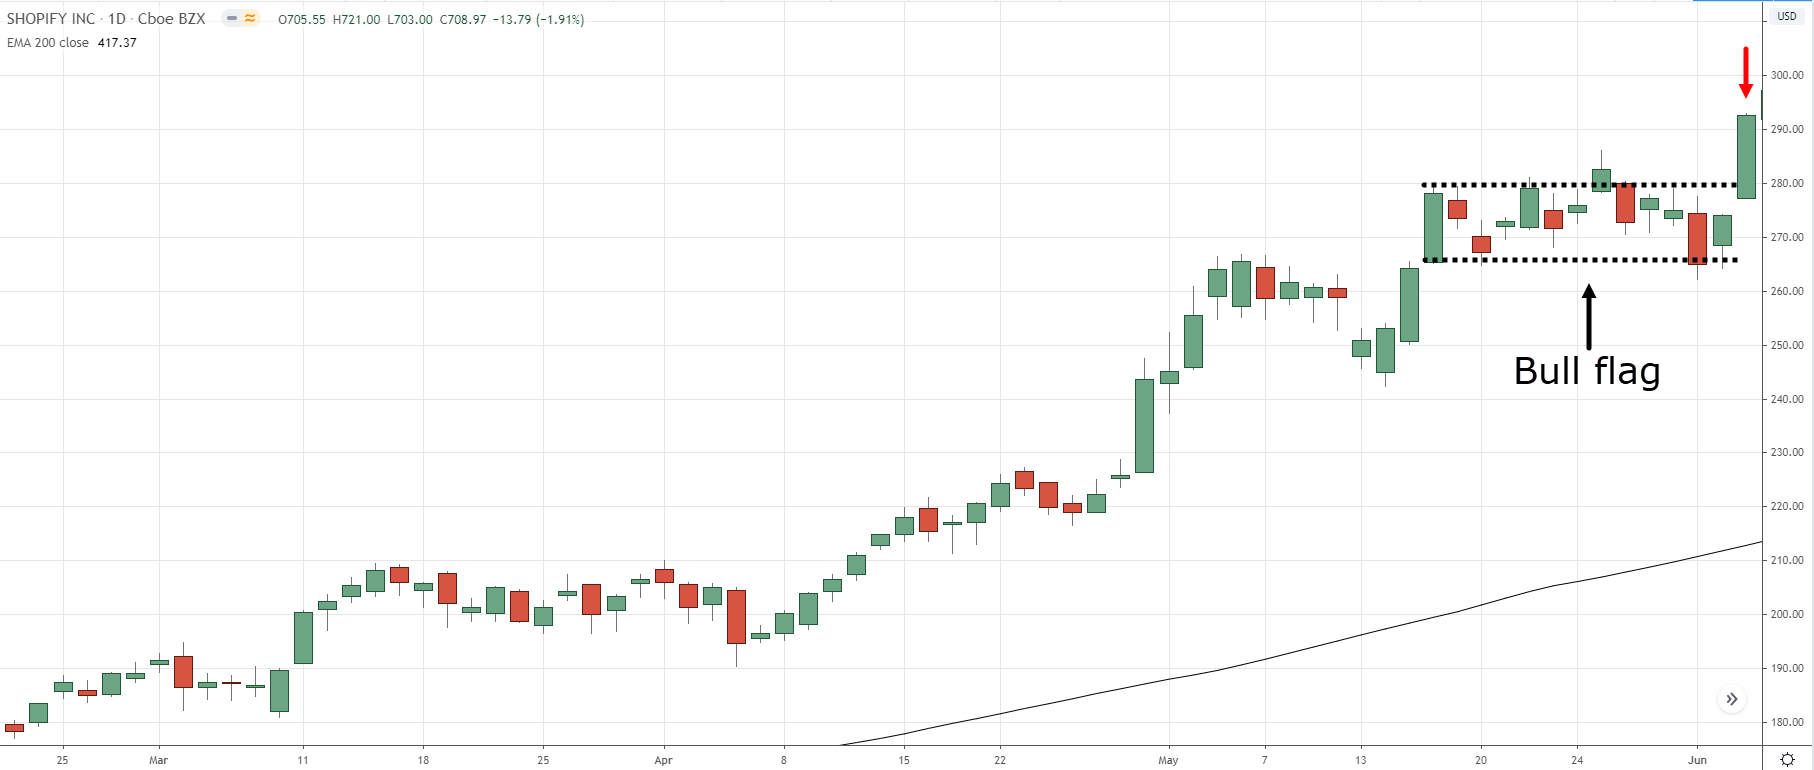
Shopify is in an uptrend as the price is above the 200-day moving average.
The stock formed a bull flag pattern which presents a long trading opportunity when the price broke out of the highs of the flag pattern.
You can set your stop loss 1 ATR below the low of the flag pattern or adopt a trailing stop loss (more details later).
Now, the reason for 1 ATR below the low of the flag pattern is because it’s easy for the price to trade a few ticks below the low—and then make a reversal higher.
That’s why you want to give your trade more breathing room and have your stop loss 1 ATR below the low of the flag pattern.
If you want to learn more, then check out this training video.
2. Boeing Daily Timeframe
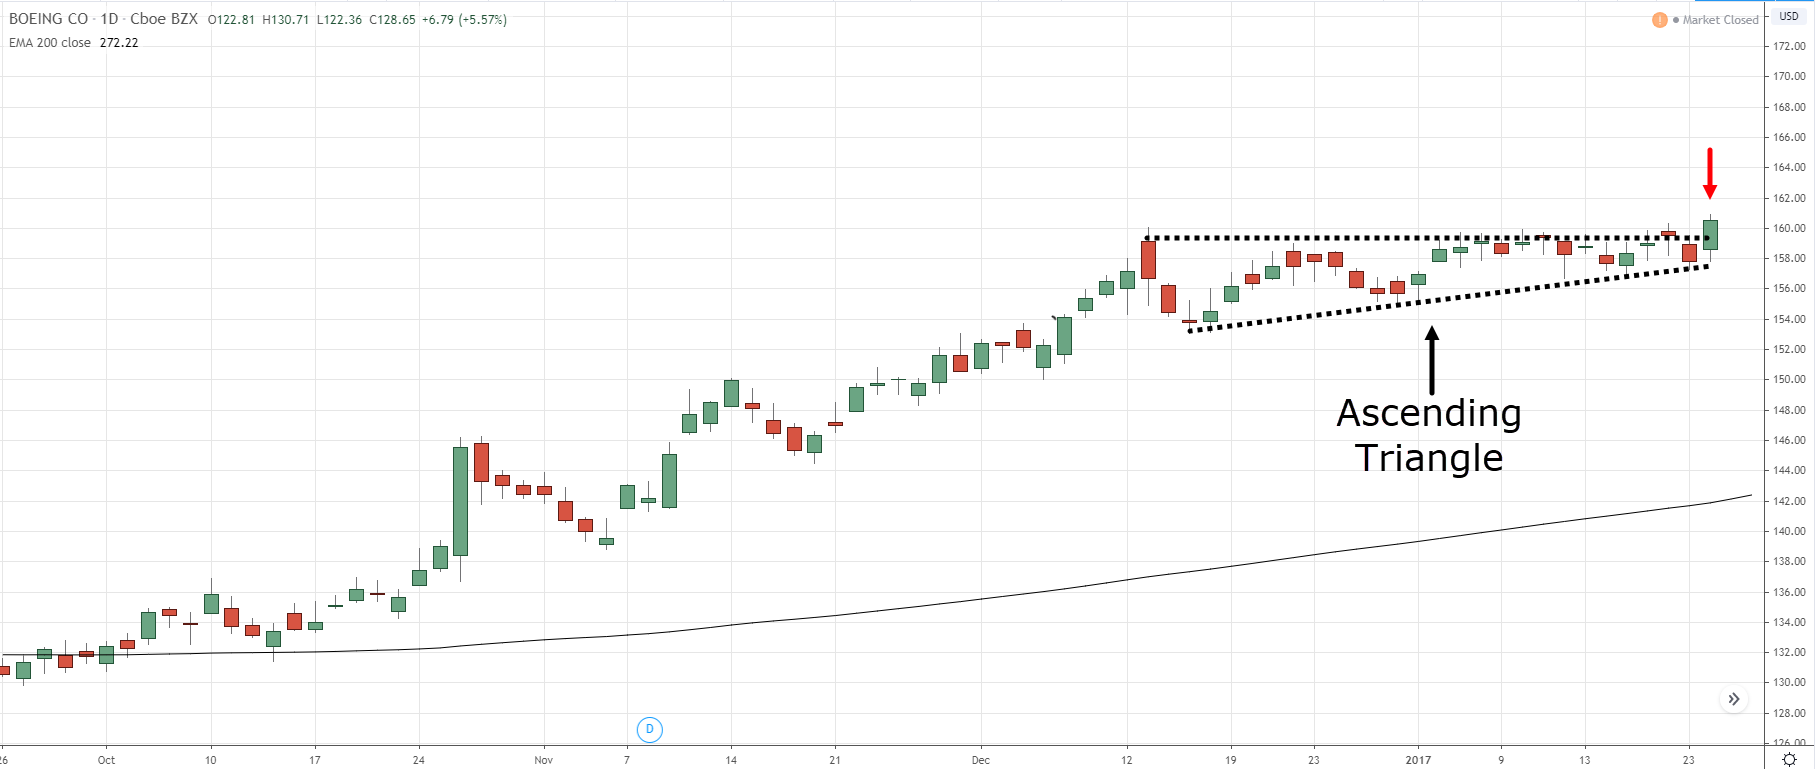
Just like our previous example, Boeing is in an uptrend as the price is above the 200-day moving average.
What’s interesting is this time around, the price formed an ascending triangle into the swing high at $160.00.
This is a sign of strength as it tells you the buyers are willing to buy at higher prices and the sellers lack the strength to push the price lower (that’s why the retracement gets smaller each time).
For this setup, you can buy the breakout of the ascending triangle and have your stop loss 1 ATR below the previous swing low or use a trailing stop loss.3. Microsoft Daily Timeframe
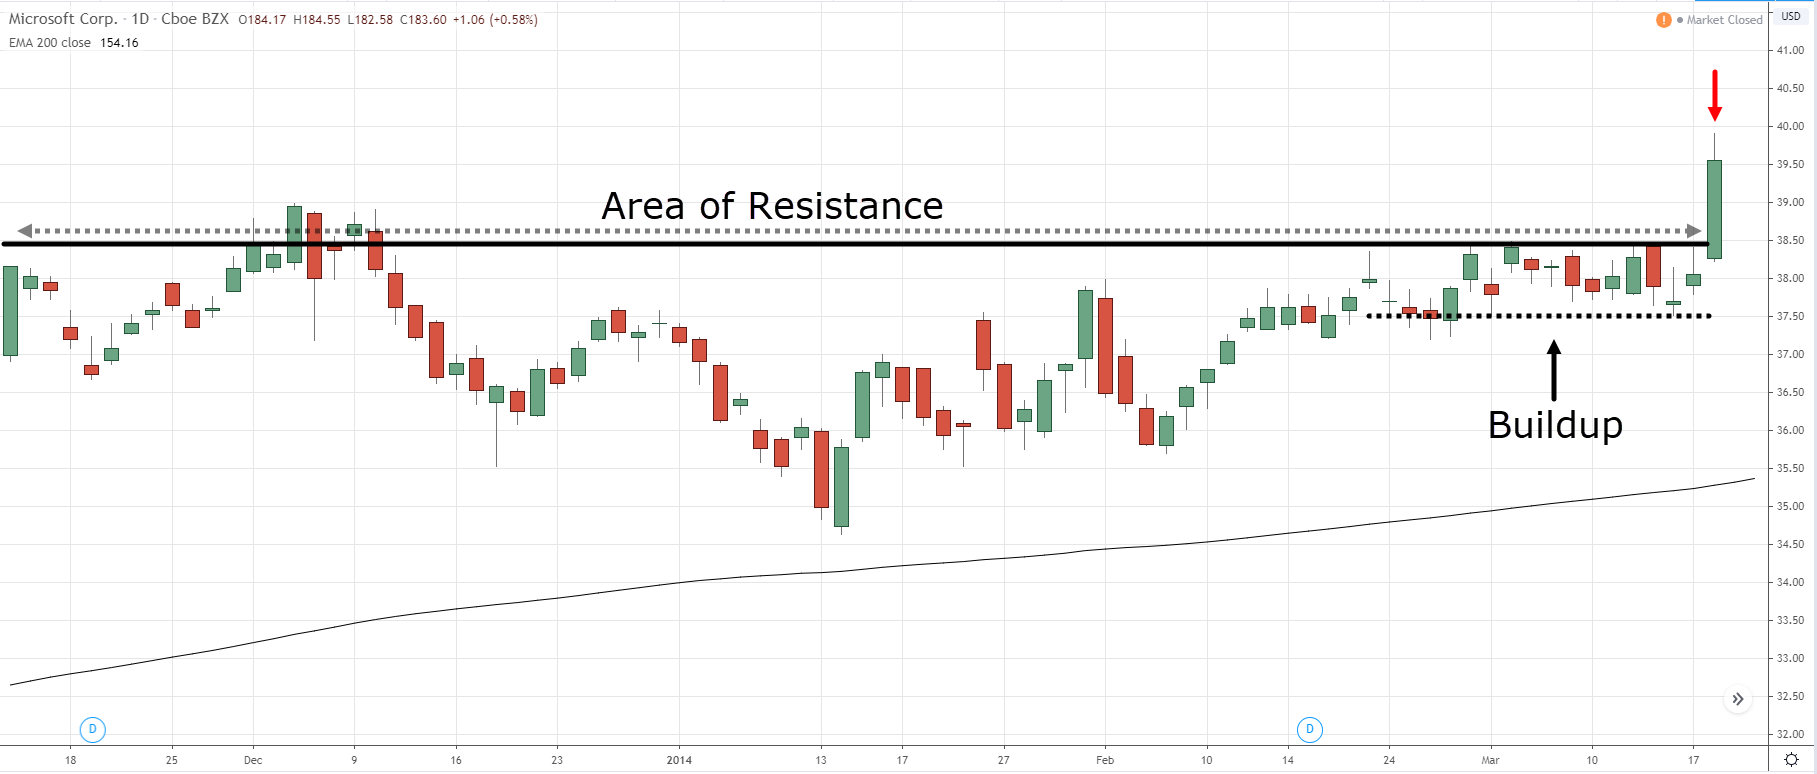
Unlike the earlier examples which are in an uptrend, Microsoft is in a range market condition (but still above the 200-day moving average).
Now the setup is what I call the breakout with a buildup—a tight consolidation that looks like the price is getting “squeezed”.
This is a sign of strength as it tells you the buyers are willing to buy at higher prices (even at resistance).
Likewise, for this setup, you can place a buy stop order above the highs of the buildup (or resistance) and have your stop loss 1 ATR below the lows of the buildup or use a trailing stop loss.Pro Tip:
You can overlay the 20-day moving average on your charts. When it touches the low of the buildup, that’s a sign the market is ready to make a move.Shooting Stocks Strategy: Exits
As a Shooting Stocks trader, you want to ride the trend until it ends.
After all, stocks that exhibit recent strong momentum tends to continue moving higher. So why cut your profits short when the market wants to give you more?
So here are a few techniques to help you ride the trend:
- Percentage
- Moving average
- Chandelier Kroll
- Market structure
% stop loss
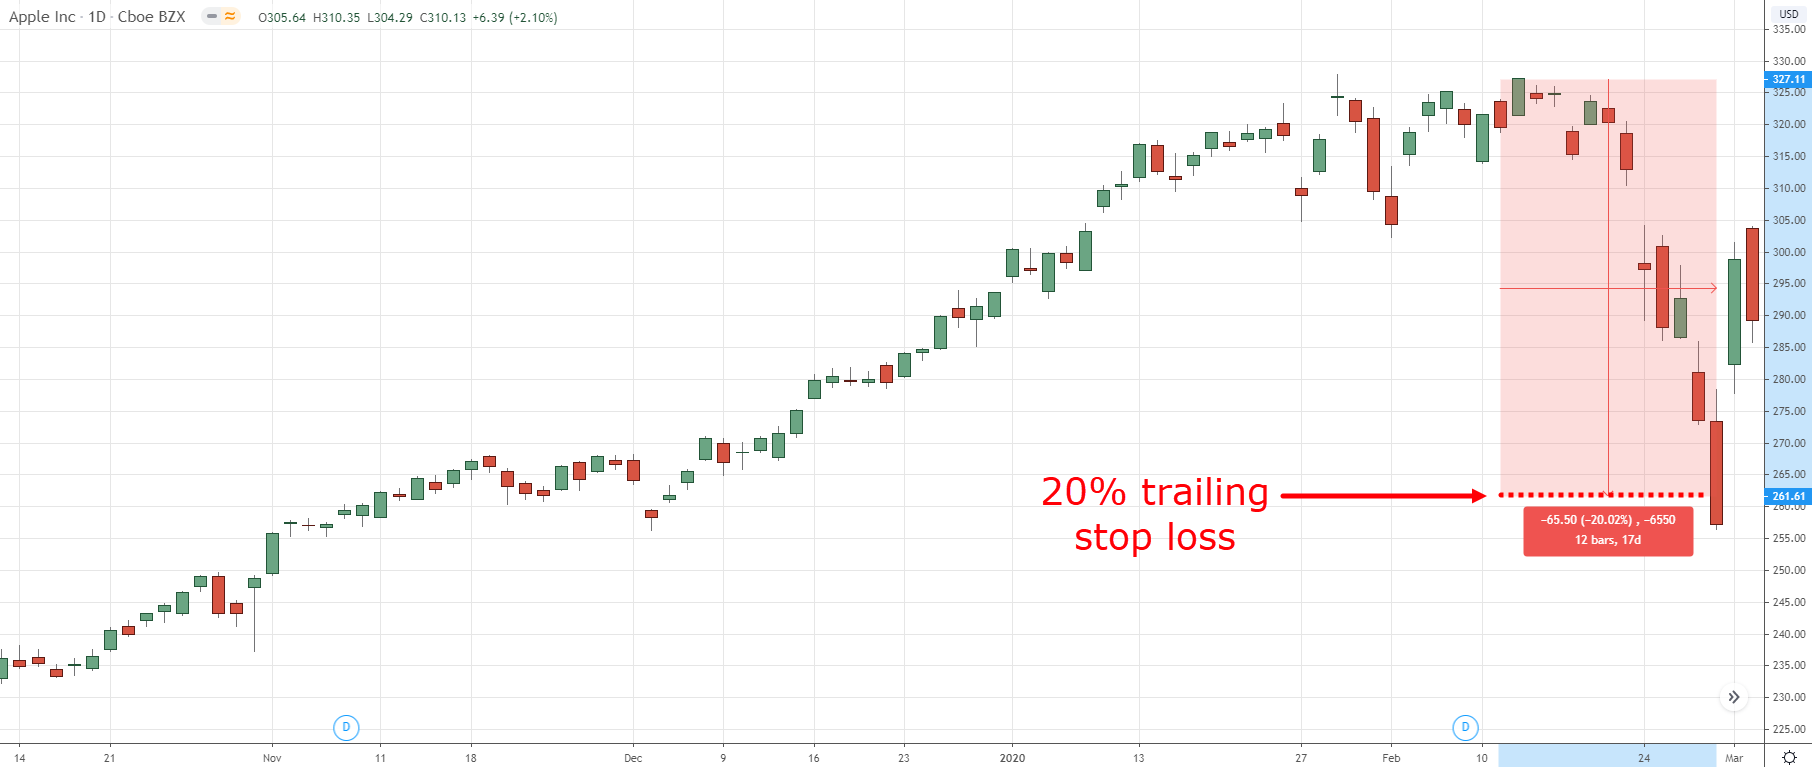
The % trailing stop loss is a simple and effective way to ride the trend.
Here’s how it works…
When you buy a stock, your stop loss is 20% below your entry price. Then, as the price moves in your favour, you trail your stop loss 20% from the highs.
Here’s an example...
Apple Daily Timeframe:
Pro Tip:
If you want to ride a longer-term trend, you can adjust your trailing stop loss to 25%, 30%, or even 40%.
But bear in mind, the wider your trailing stop loss, the more open profits you’ll give back (no two ways about it).
Moving average stop loss
Enter your text here...
Moving average is a Trend Following indicator. It can help you identify the trend, better time your entries, and trail your stop loss to ride trends in the market.
For this section, we’ll focus on how to ride trends using the moving average indicator.
Here’s how it works…
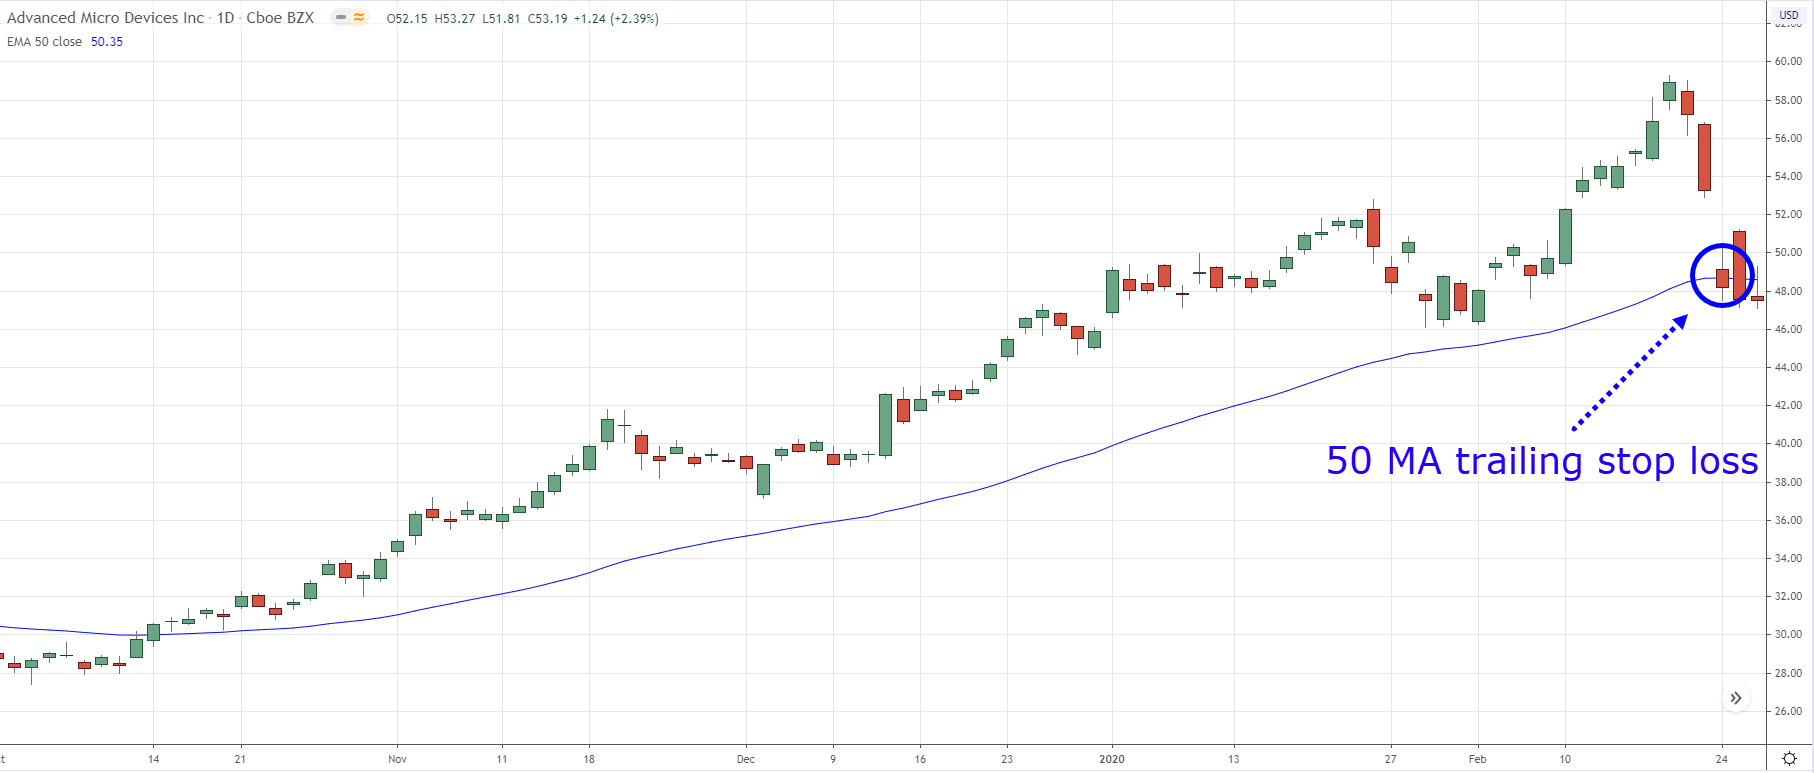
When you buy a stock, your stop loss is below the 50-day moving average and you’ll hold onto the stock as long as the price is above the 50-day moving average. You only exit the trade when the weekly candle closes below it.
Here’s what I mean...
AMD Daily Timeframe:
Now you’re probably wondering:
“Why the 50-day moving average?”
There’s no special reason for it. If you want to ride a longer-term trend you can tweak it to a 100-day moving average.
Or if you want to ride a short-term trend, you can use a 20-day moving average. Remember, the concept is what matters.Chandelier Kroll stop loss
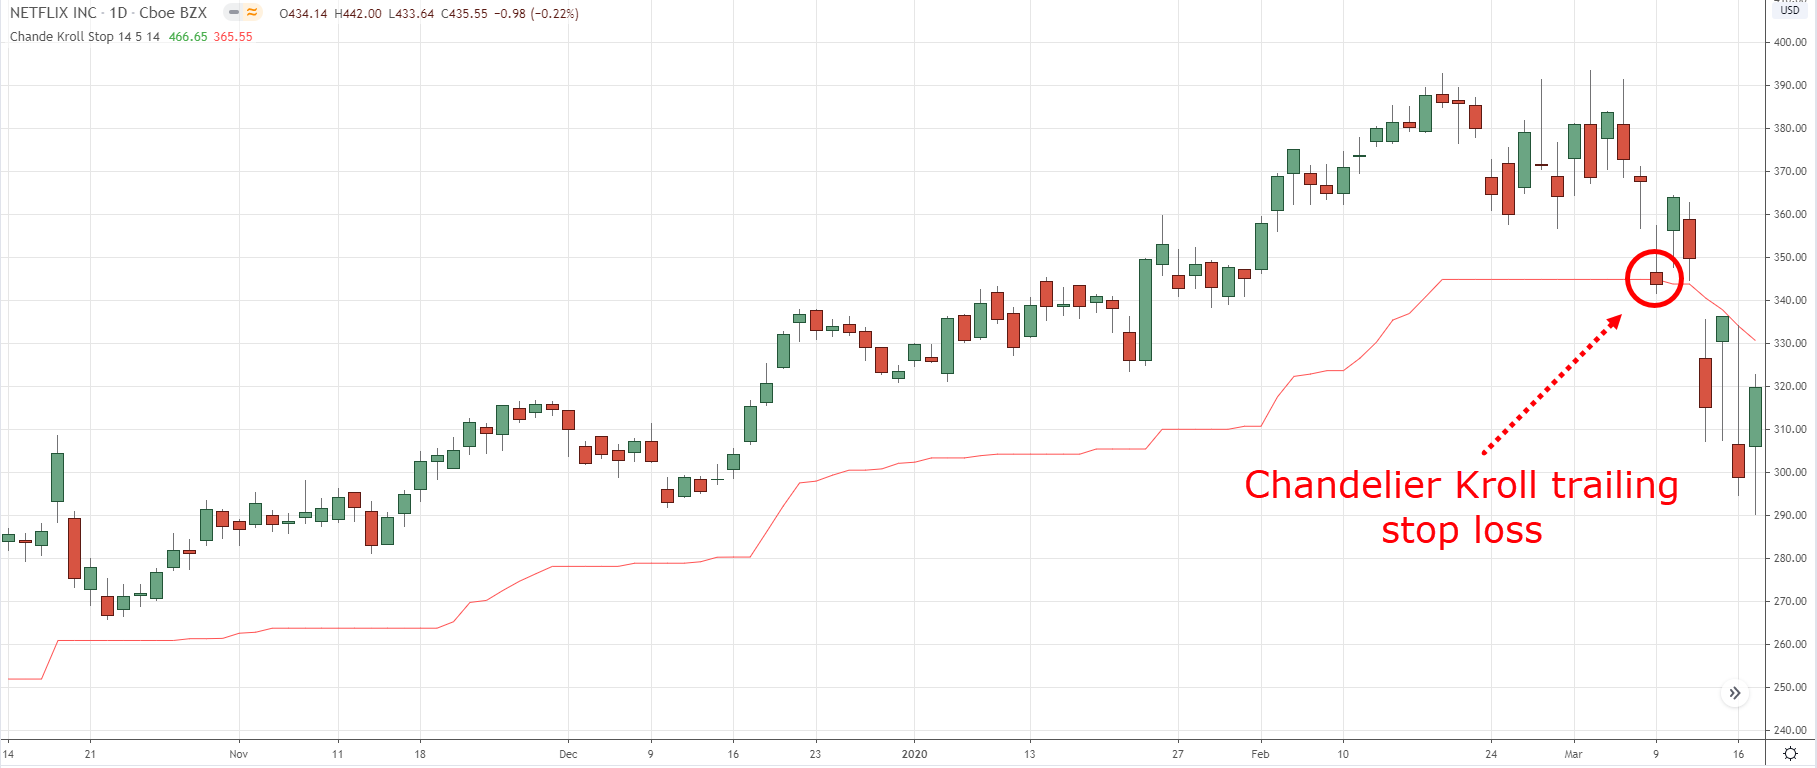
The Chandelier Kroll is a variation of the average true range (ATR) indicator, which is a volatility-based indicator.
This means as the volatility of the market expands, your trailing stop loss gets wider to take into account the increase in volatility (and vice versa).
So to use a Chandelier Kroll stop, you must first decide the multiple you want to use.
For example, if you use a multiple of 5, then it’ll take the current ATR value and multiple it by 5, and that’s the distance of your trailing stop loss (which is 5 ATR from the highs).
Here’s an example…
Netflix Daily Timeframe:
Pro Tip:
If you want to ride a longer-term trend, use a higher multiple like 6 or more. And if you want to ride a shorter-term trend, you can use a multiple of 3 or less.
Market structure
Unlike the earlier trailing stop loss techniques, riding the trend using market structure requires discretion.
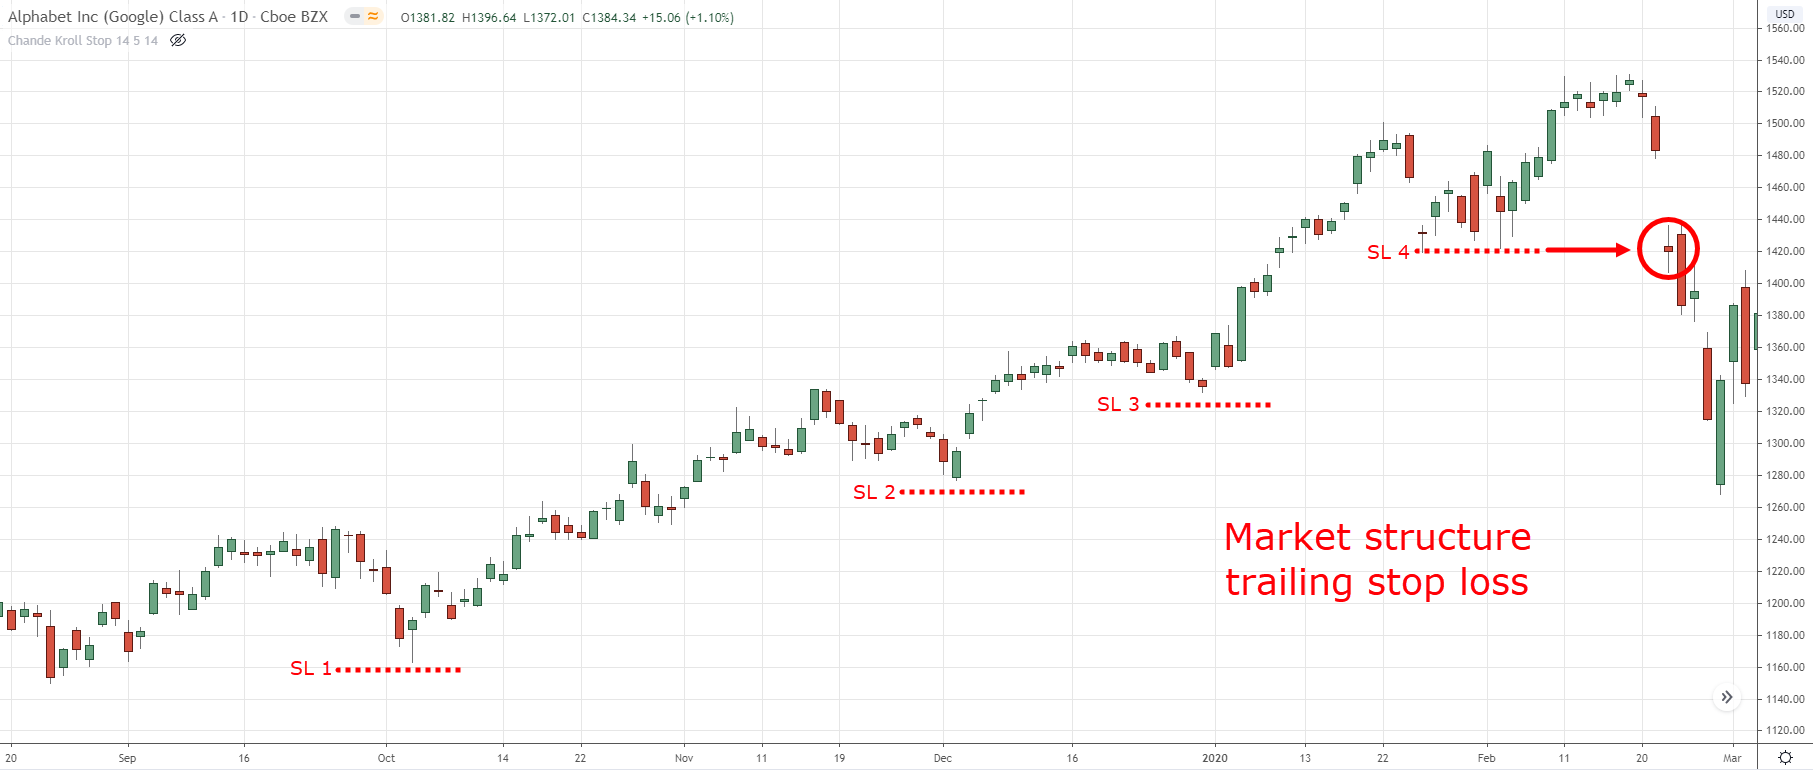
The idea behind it is, as the stock is in an uptrend, the price will continue to make higher highs and lows.
This means you can trail your stop loss below the previous swing low and you’ll sell it only when the price breaks through it.
Here’s an example...
Google Daily Timeframe:
Pro Tip:
It’s common for the price to take out the previous swing low and then reverse higher.
So what you can do is, set your stop loss 1 ATR below the swing low and exit only if the price closes below that level.
Now you’re probably wondering…
“So, which trailing stop loss should I use?”
If you’re new to trading, I recommend you use a trailing stop loss with objective rules because it takes the guesswork out of your trading which gives you more consistent results.
So, the % trailing stop loss, Chandelier Kroll, and moving average are great options to consider.
But if you’re a seasoned price action trader who prefers to have “control” of your exits, then the market structure approach would suit you best.
Moving on…
Bonus tips
Before I end this post, I want to share with you a few bonus tips that which will help your shooting stocks trading journey…
#1: Hold onto cash during bear markets
In the book The Alpha Formula by Larry Connors and Chris Cain, they found that stocks above the 200-day moving average tend to move higher (and stocks below it tends to move lower).
This means that during a recession, you want to hold onto cash as the likelihood of making money isn’t in your favour.
Yes, holding onto cash doesn’t earn you any returns but, it beats watching your portfolio sink even redder as the days go by.
Remember, trading isn’t just about how much you earn but also, how much you can lose.
#2 Focus on stocks that have the highest rate of change (ROC) values
Here’s why…
Stocks with the highest ROC values (over the last 50-weeks) have the strongest momentum behind them—and these are stocks which tend to outperform the market.
So, what does it mean for you?
Simple.
When you have multiple trading setups and you can’t decide which stocks to buy, then go with the one with the higher ROC value. You have better odds with it.#3 Use a stock scanner to make your life easier
Now there are thousands of stocks out there and I don’t expect you to manually scan through each stock, one by one.
Instead, you can use a stock scanner like Thinkorswim to make your life easier.
Here are the settings to use:
- Scan universe is the Russell 1000 (or whichever index you prefer)
- Stock must be above the 200-day moving average
- The stock price is 0 – 10% below the 52-week highs
- Rank them according to the 50-week ROC
With a little bit of programming, you can filter down your list of stocks for each trading week.
Pro Tip:
If you don’t know how to program, just go to Fiverr and hire someone to help you with it.
Conclusion
So here’s what you’ve learned today:
- The shooting stocks strategy uses chart patterns to buy the strongest stocks out there, and then to hold these stocks till the trend ends
- You can use chart patterns like a bull flag, ascending triangle, or breakout with a buildup to time your entry
- You can trail your stop loss using % decline, moving average, Chandelier Kroll, or market structure
- Avoid buying stocks during a bear market as the odds are not in your favour
Now here’s what I’d like to know…
How would you apply the shooting stocks strategy to your trading?
Leave a comment below and share your thoughts with me.

I believe that you can use a scanner from sites such as Finviz.com. I have seen that very successful traders such as Mark Minervini has used the VCP method to trade momentum stocks. Great content from identifying, to entering and exiting the trade.
Thanks for contributing, Rohan!
Very useful for traders
Definitely, glad you were able to benefit from it!
Hey hey hey my friend! I’ve increased my 1grand account into 11,856.00. And from sometime last month to date my account has reduced to 9,908.00 with the same strategy I’m using, I loss almost every trade I place. What’s going on?
Hey there Mohammed, one issue could be that the markets you’re trading may be different from ours (we trade the Russell 3000)
And that you’re allocating more than 5% of your capital per trade.
HOWEVER, if you’re sure that you’re following our rules correctly, then the system is currently in a drawdown (which happens to every strategy)
Nonetheless, feel free to email us at support@shootingstocks.com and we’ll do our best to help you out
Nice I’ll try
Good luck, Adam!
Uzun süredir aradığım güvenilir bahis siteleri hakkındaki analizler çok değerli.
Glock 19 Gen 5 Battlefield Green in stock � limited edition, order now.