The RSI indicator is one of the most popular trading indicators out there.
However, almost all new traders get it wrong.
That’s why in today’s post, you’ll discover:
- The truth about the RSI indicator and why it’s not what you think
- The #1 RSI indicator mistake made by most traders—and how you can avoid it
- How to use the RSI indicator to quickly improve your winning rate
- How to use the RSI indicator to better time your entries & exits like a pro
- Which is the best market for the RSI indicator (hint: you’ll never guess what it is)
Cool?
Then let’s get started…
What is RSI indicator and how does it work?
The RSI (relative strength index) is a momentum indicator developed by J. Welles Wilder.
It oscillates between 0 and 100 and the purpose is to measure the “speed” of a price movement.
This means the faster the price goes up, the higher the RSI value (and vice versa).
Here’s the RSI Indicator formula…
RSI = 100 – 100 / [1 + RS]
Where RS = Average Gain / Average Loss
Wait!
Don’t let the math scare you because this isn’t as “scary” as it looks.
I’ll break this down that even a 10-year-old can understand.
Let’s get started…
How does the RSI indicator work?
As you can see, the only “tricky” thing is the RS calculation which is defined as…
Average Gain / Average Loss
In other words, the RSI indicator goes up when the average gain is large (or when the average loss is small).
Now you might be wondering:
“How does the value of the average gain goes up?
Simple.
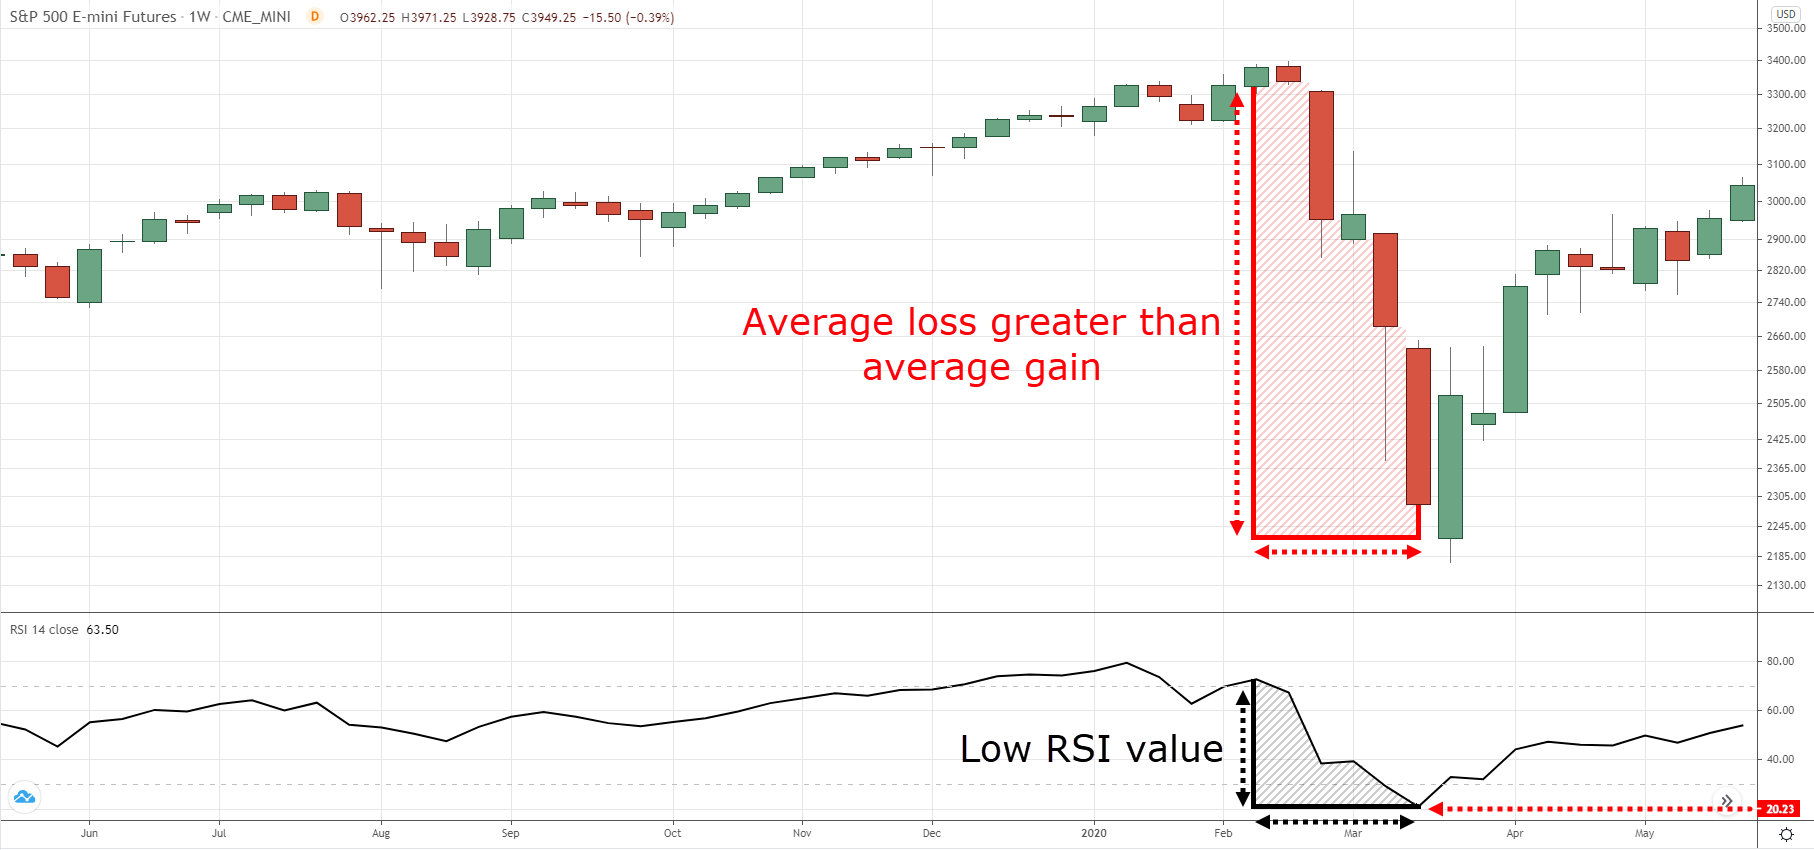
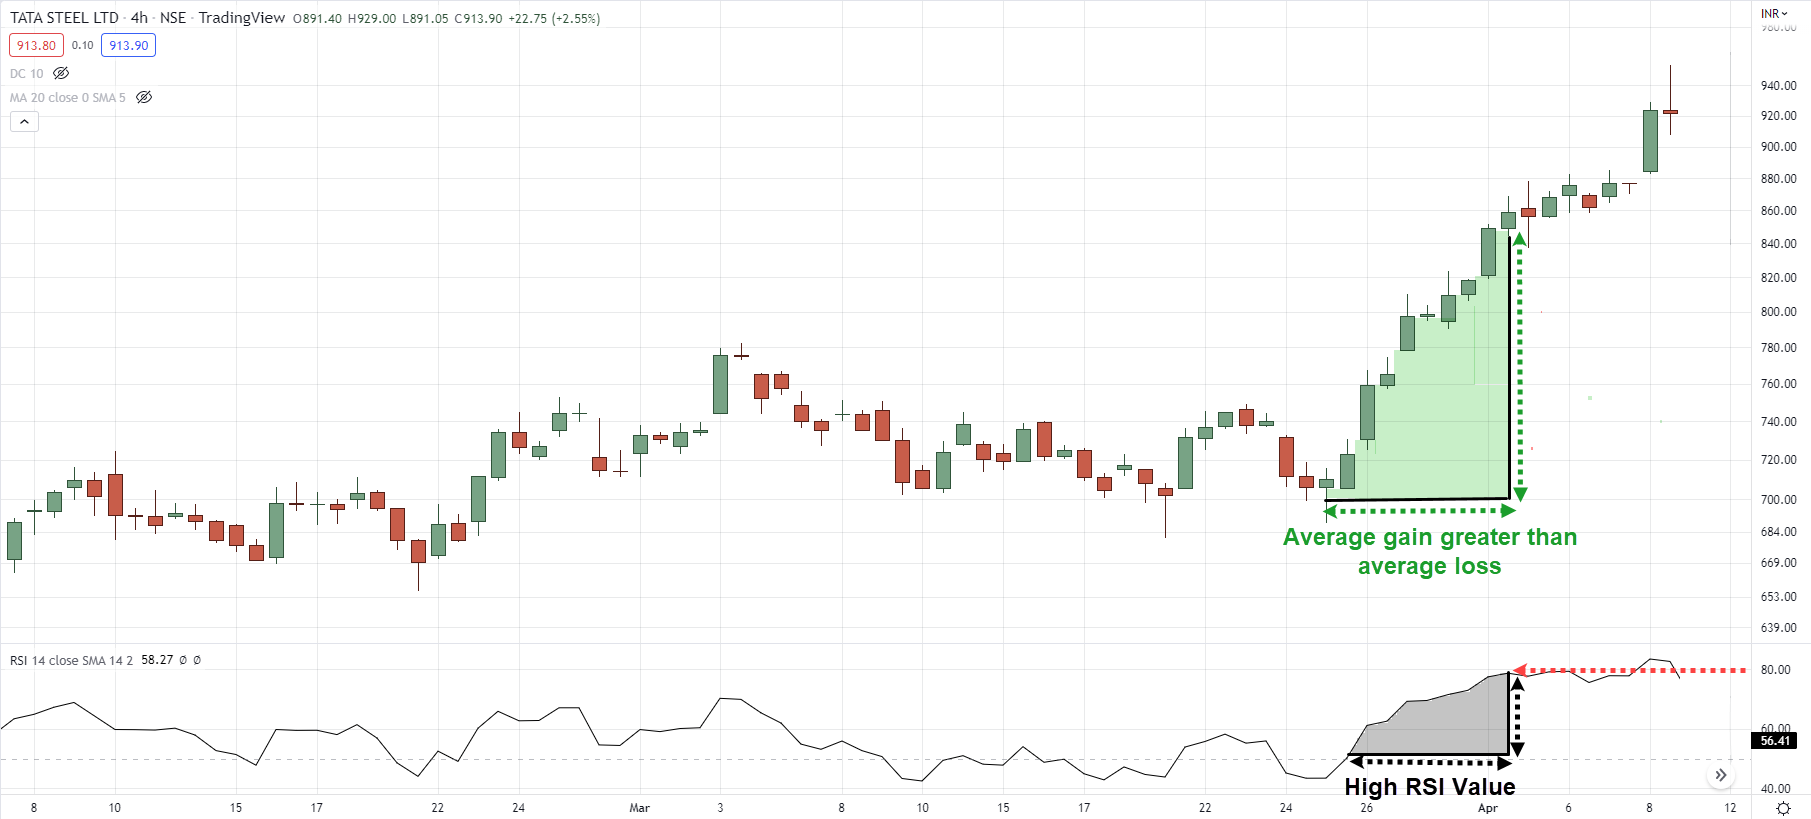
When the price moves up quickly with little to no pullbacks, your average gain is large because the price is making positive gains—which leads to a higher RSI value.
Likewise, when the price tanks quickly with little to no pullbacks, your average loss is large because the price is making negative gains—which leads to a lower RSI value.
And finally…
The average gain/loss can be manipulated by the RSI settings.
For example:
- If you choose a 14-period RSI, then the average gain (and loss) will be based on the last 14 candles
- If you choose a 5-period RSI, then the average gain (and loss) will be based on the last 5 candles
So if you used a lower RSI period settings, the more sensitive the indicator will be to recent price movements (and it’s just the opposite for higher RSI period settings).
Make sense?
Here’s the RSI indicator in action (using the default 14-period RSI)…
Now you might be wondering:
“Stochastic indicator vs RSI, what’s the difference?”
Well, they are similar but different.
I’ll explain…
The stochastic indicator and RSI are similar because they are both momentum oscillators.
In other words, they measure momentum in the market and their values range between 0 and 100.
But how are they different?
Well, the calculations that go into the stochastic indicator and the RSI indicator are different.
However, they use the same concept which is to measure momentum.
Thus, you shouldn’t be surprised to see both stochastic indicator and RSI pointing in the same direction (albeit with different values).
So, the bottom line is this…
If you want to use a momentum indicator (like RSI or Stochastic), just pick one will do because they pretty much tell you the same thing.
Moving on…
RSI Indicator: Do you make this trading mistake?
Here’s the thing:
When the RSI is below 30, it’s considered oversold. And when it’s above 70, it’s considered overbought.
So, what do traders do when the RSI is oversold?
Well, they think the market can’t go any lower so they hit the buy button to go long.
Big mistake.
Why?
Because you’ve learned earlier that the RSI indicator measures momentum in the market.
In other words…
If the RSI is oversold, it’s a signal that there’s strong bearish momentum in the markets. And if the RSI is overbought, then there’s strong bullish momentum.
So…
Do you want to blindly buy just because there’s strong bearish momentum in the market?
Or hit the sell button because the price seems too high?
I hope not.
So, don’t make the mistake of buying just because the RSI is oversold because what’s oversold can be even “more oversold”.
How to use the RSI indicator and improve your winning rate, fast
Recall:
The RSI indicator measures the average gain to loss (over a given period) to determine momentum in the markets.
For example:
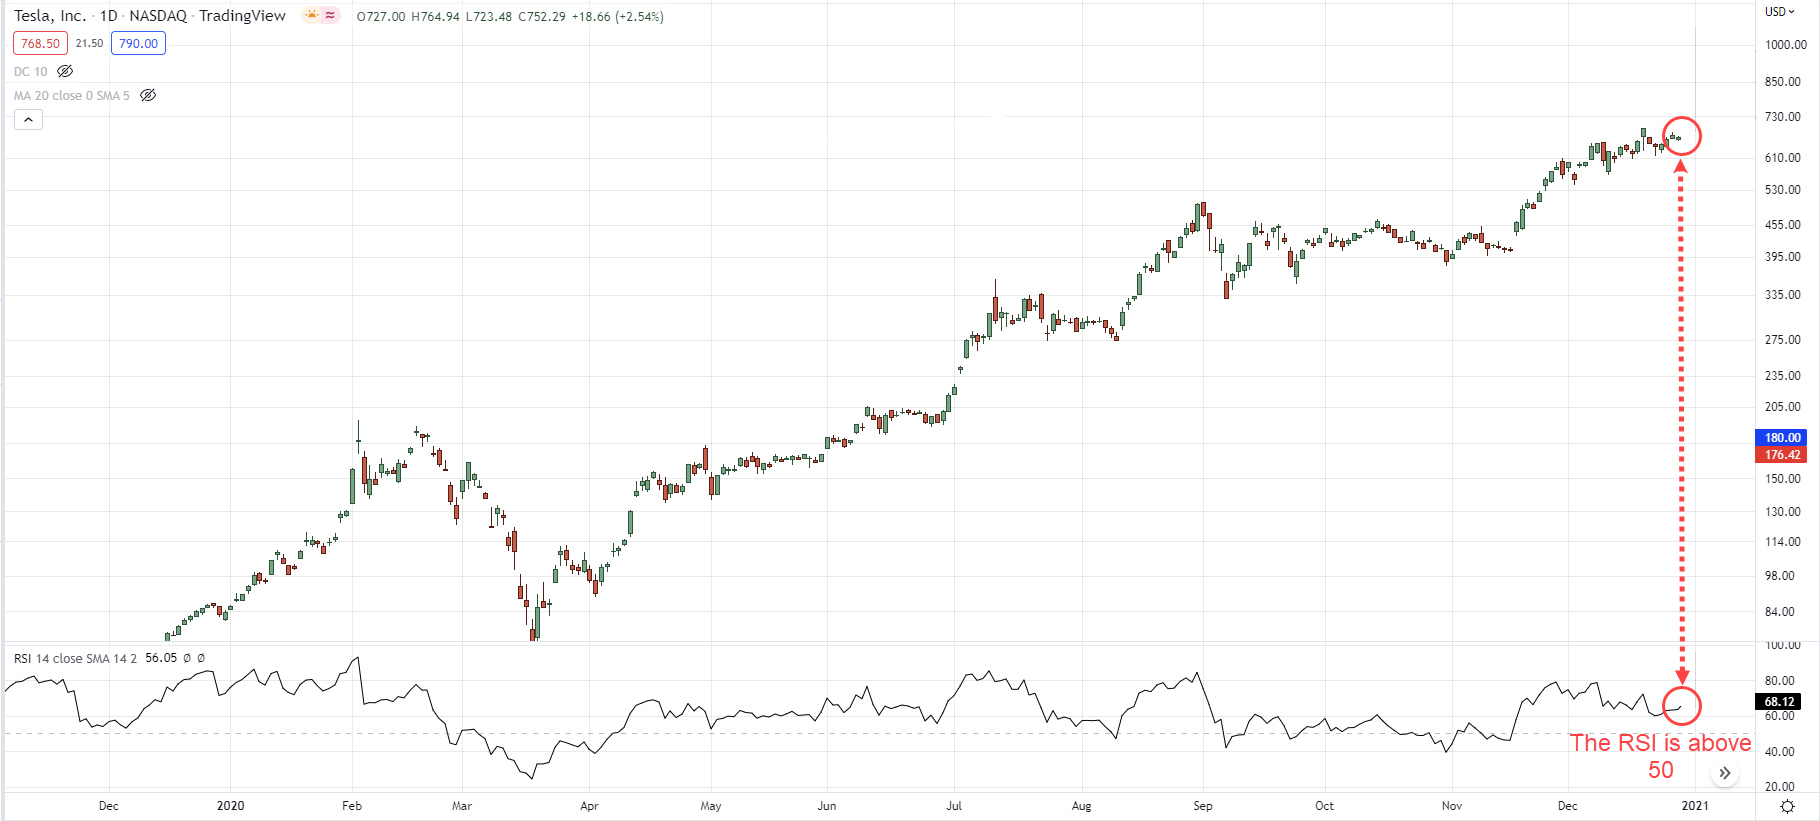
If the RSI is above 50, it means that the average gain is greater than the average loss over a given period.
And if the RSI is below 50, it means the average gain is lesser than the average loss over a given period.
So, how can you use this and improve your winning rate?
Simple.
You can use the RSI indicator as a trend filter so you’ll know whether to be a buyer or seller in any given market condition.
Here’s how:
- Adjust the RSI indicator to 200-period (so you can identify the average gain to loss over a longer time horizon)
- If the 200-period RSI is above 50, then the market is likely in an uptrend and you want to look for buying opportunities
- If the 200-period RSI is below 50, then the market is likely in a downtrend and you want to look for selling opportunities
An example…
Next…
RSI indicator: How to use it to better time your entry
When it comes to entry trigger, most traders are familiar with chart patterns, candlestick patterns, etc.
Now, there’s nothing wrong with these techniques but they have an element of subjectivity.
But what if you want something objective as your entry trigger?
Well, that’s where the RSI indicator comes into play.
Let me explain…
When the RSI is below 30, it signals that there’s strong bearish momentum as the average loss is higher than the average gain.
But when the RSI crosses above 30, it sends you another message.
It tells you there’s buying pressure stepping in which explains the increased value of the RSI indicator.
So when the RSI indicator crosses above 30, you can use this as an entry trigger to enter a trade (assuming other conditions are met).
Here’s an example…
Pro Tip:
Don’t blindly buy just because the RSI crosses above 30.
This is an entry trigger, the “pattern” which gets you into a trade—not a trading strategy in itself.
RSI indicator: How to use it to capture a swing for consistent profits
Let’s take things in the opposite direction and discover how the RSI indicator allows you to capture a swing in the markets.
For starters, swing trading is a methodology that seeks to capture “one move” (otherwise known as a swing) in the markets. And to achieve this, you’ll sell into a rally as the price moves higher.
An example:

So now the question is…
How do you know when to sell before the momentum fizzles out—and reverses against you?
Good question.
That’s where the RSI indicator comes into play, again (duh since this is an article on RSI indicator).
So, what you can do is to sell your position when the RSI crosses above 60.
This means there’s buying pressure pushing the price higher and it’s an opportunity for you to sell into the rally.
Now you’re probably wondering:
“Why do you look for the RSI indicator to cross above 60?”
Well, there’s nothing “magical” to it because the concept is what matters.
I’d say anywhere between 50 to 60 would give you a decent chance to capture a swing.
Anything higher, then you’ll have to endure the retracement and pullbacks along the way.
Anything lower, and the swing might be too small to be worth your time.
Anyway…
Don’t take my word for it.
Do the work and test it for yourself so you know which approach suits you best.
Which is the best market to use the RSI indicator?
I rarely use the word “best” in trading because the context matters.
But turns out, there’s a certain market which the RSI indicator works exceptionally well.
Do you know what it is?
It’s the stock market.
Why?
Let me explain…
The stock market is in a long-term uptrend because it’s a reflection of a country’s economy.
So if an economy progresses over time, it will be reflected in the stock market with higher asset prices.
And for most countries, their economy is stronger than they were compared to decades ago—which explains why their stock market is in a long-term uptrend.
However, just because the stock market is in a long-term uptrend doesn’t mean it goes up every day.
Nope. It still encounters pullback which offers us an opportunity to “buy low and sell high”.
But how?
Well, this is where the RSI indicator comes into play, again.
Let me explain…
When the RSI indicator is “oversold”, it signals there’s strong bearish momentum in the markets.
At the same time, you know the stock market is in a long-term uptrend and most pullbacks would lead to a resumption of the trend.
So, what does it mean?
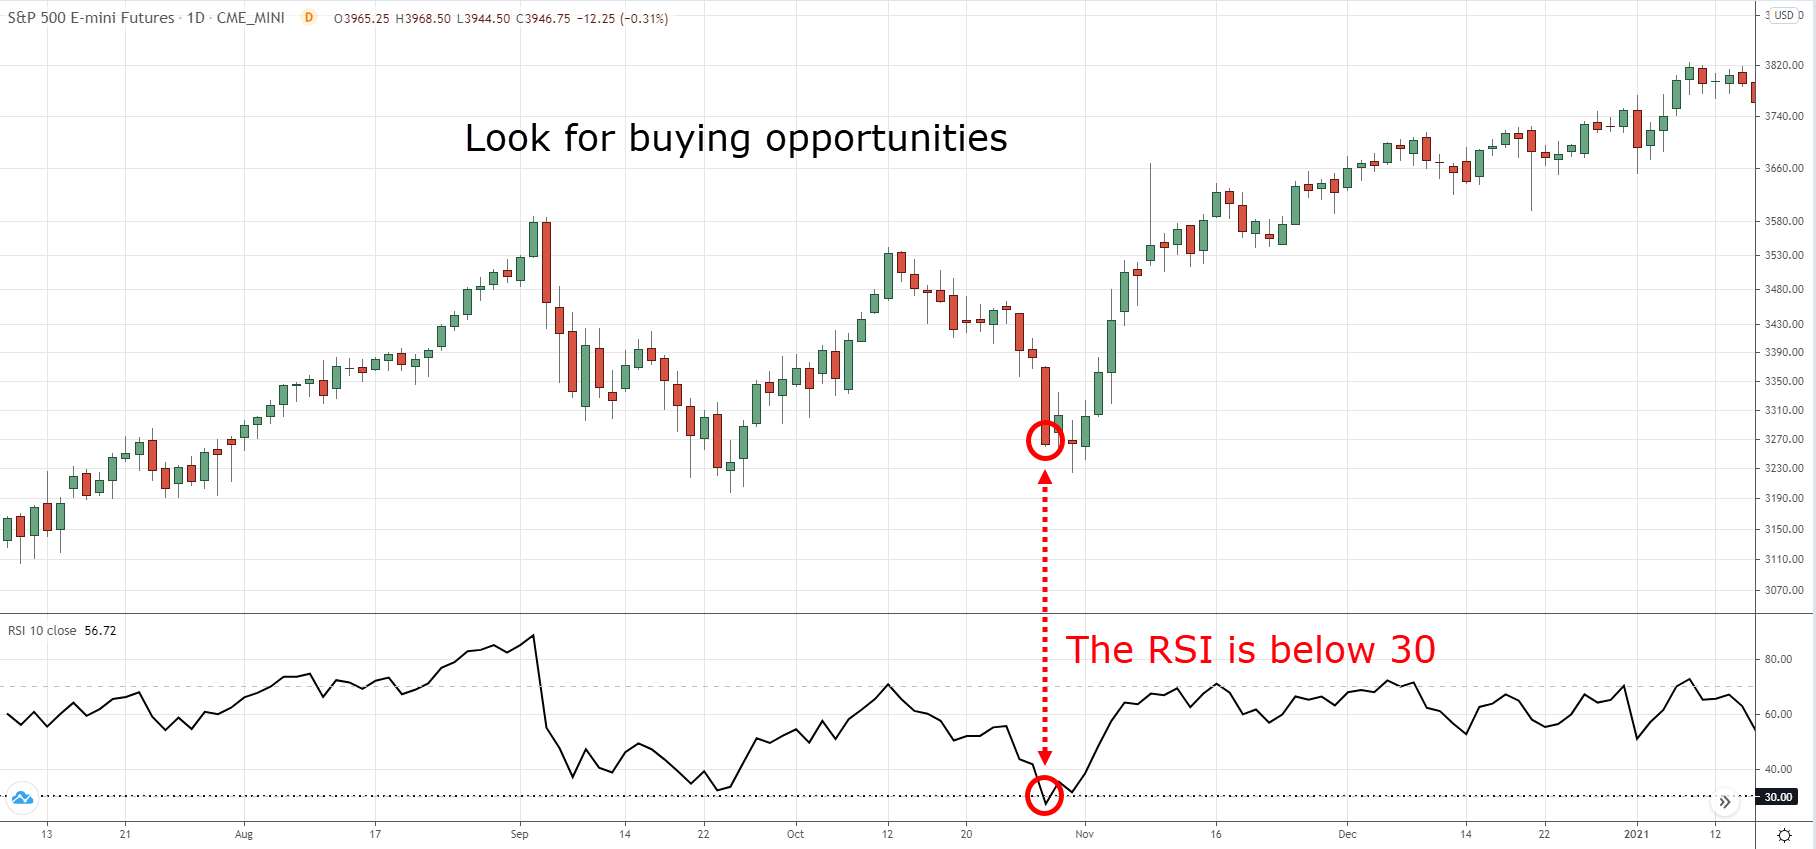
This means when the RSI indicator is “oversold”, it presents buying opportunities in the stock market since the trend is likely to continue higher.
Here’s how to apply it:
- Use a 10-period RSI setting on the S&P 500
- Look for buying opportunities when the 10-period RSI goes below 30
An example…
Pro Tip:
You can apply this concept to trade individual stocks for more trading opportunities. If you want to learn more, then check out The Pullback Stock Trading System.
Conclusion
So here’s what you’ve learned in this post:
- The RSI indicator measures momentum in the market—the faster the price moves up, the greater the RSI value
- Don’t blindly buy just because the RSI indicator is oversold because it can get even “more oversold”
- You can use the RSI indicator as a trend filter—if the price is above the 200-period RSI, then look for buying opportunities, if the price is below it, then look for selling opportunities
- The RSI indicator can serve as an entry trigger when it crosses above 30 (assuming other conditions are met)
- If you want to capture a swing in the markets, you can look to exit your trade when the RSI indicator crosses above 60
- The RSI indicator works well in the S&P 500—you can look for buying opportunities when the 10-period RSI is below 30 on the S&P 500
Over to you...
How do you use the RSI Indicator?
Have you learned something new in today's training guide?
Let me know your thoughts in the comments below!

Yes good learning
Great to year that, Matin!
Hello Sir, All example are taken RSI(14) instead of RSI(200)…correct if I’m wrong
Hey there Parmanand, yes, we use the standard 14-period!
Always informative and knowledgeable article as usual
Thank you, Vishal!