When it comes to price action patterns, most traders will think of…
“Hammer”
“Shooting star”
“Engulfing pattern”
Now, these are easy patterns to learn for beginners.
But, if you want to take your price action trading skill to the next level, then you must master new price action patterns.
That’s why in today’s post, you’ll discover 5 price action patterns that work—so you can develop sniper trading entries to trade market reversals, trend continuation, and even breakouts.
Ready?
Then let’s begin…
Price action pattern #1: False break
The false break is a reversal price action pattern that allows you to buy low and sell high.
Here’s why it works:
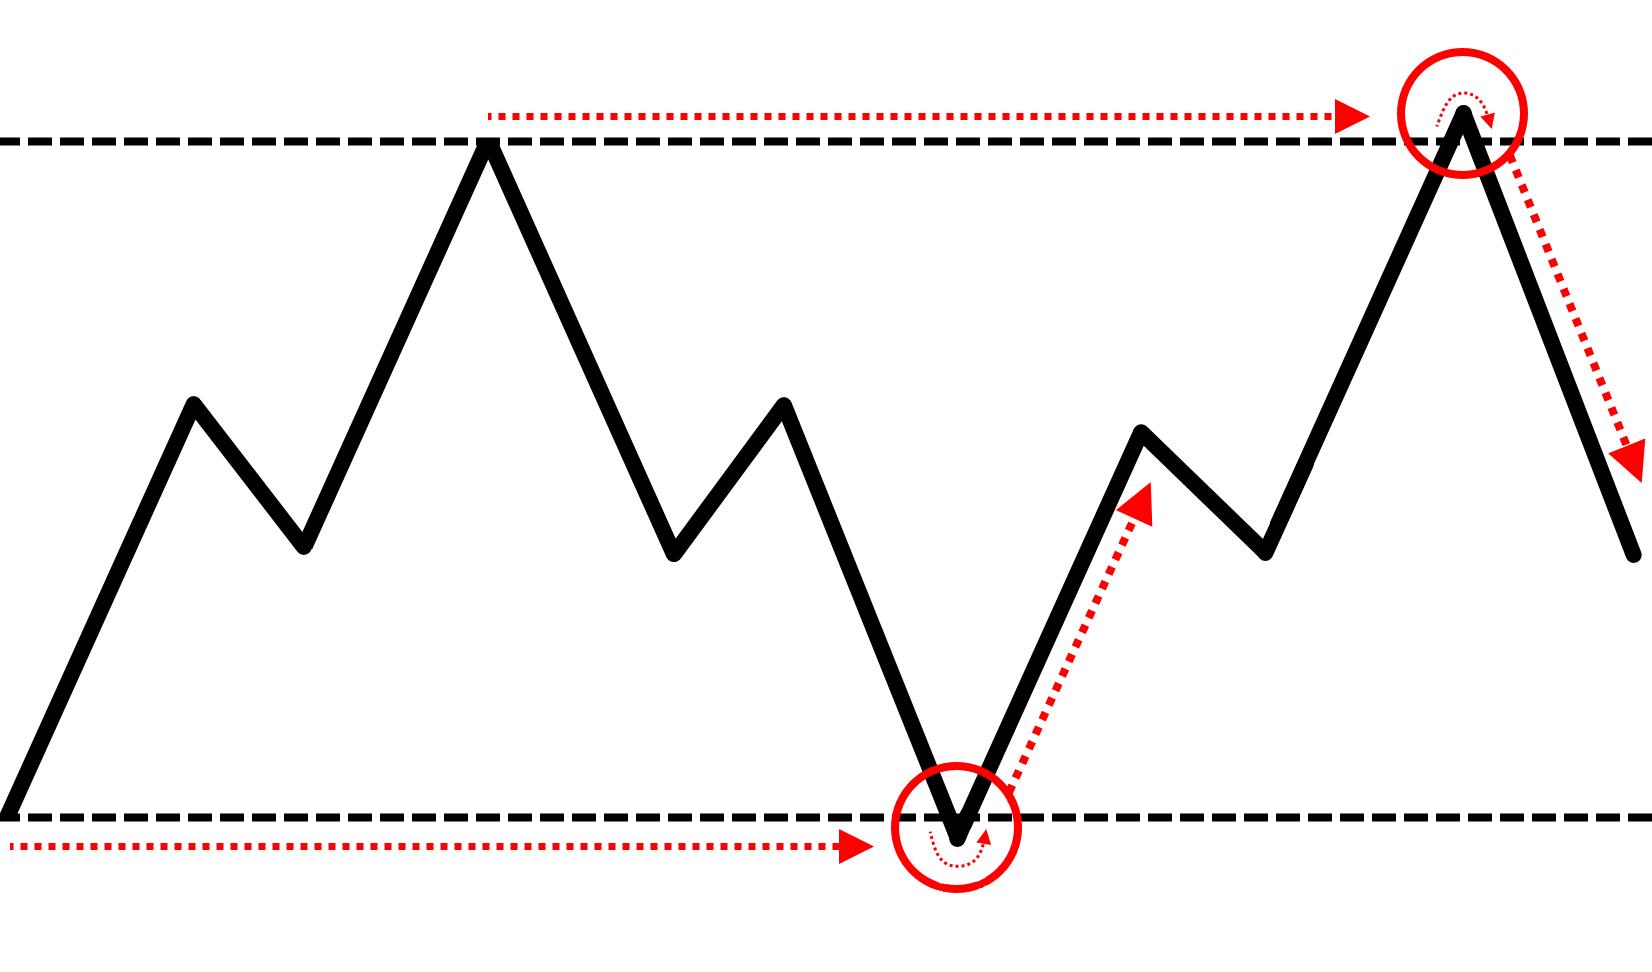
Imagine, the price makes a strong bullish move into resistance—and breaks out higher.
At this point, many traders have this thought process…
“The market is so bullish”
“Look at how big those green candles are!”
“It’s time to buy!”
So, this group of traders buy as the price breaks above resistance and their stop loss is likely below the previous candle low, below support, etc.
This means if the market makes a sudden reversal, you can agree that these cluster of stop loss will be triggered which puts selling pressure in the market.
Plus, if bearish traders step into the market and sell near the highs of resistance, you can expect the market to collapse lower and erode the gains it made earlier—that’s the power of the false break price action pattern.
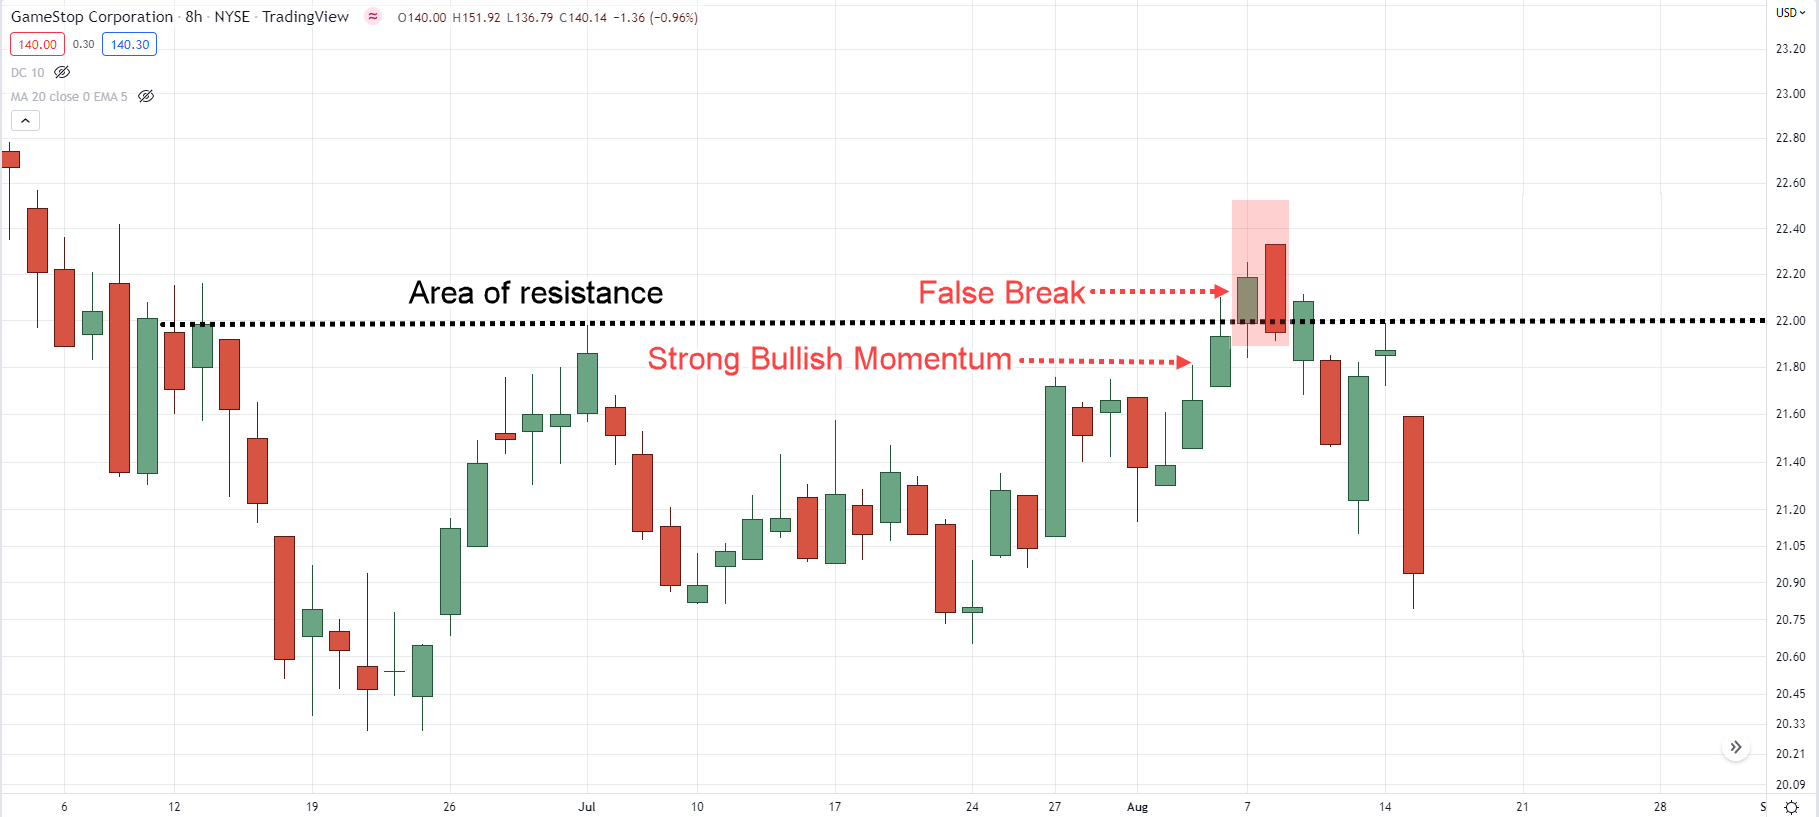
Now that you’ve understood the logic behind the false break price action pattern, then here’s how to trade it…
- Look for a strong bullish momentum into resistance (the bigger the candles, the better)
- Let the price take out the extreme highs of resistance (so that more traders will buy the breakout)
- Wait for the false break pattern where the price makes a sudden reversal and closes below resistance
- Go short on the next candle’s open
(And vice versa for a long trade)
Here’s an example:
Make sense?
Then let’s move on…
Price action pattern #2: Break of structure
The break of structure is a reversal price action pattern that allows you to enter the start of a new trend—with low risk.
Here’s why it works:

Imagine, the market has been in an uptrend over the last 200-candles.
But as you know, the price cannot go up forever. Eventually, the market gets “expensive” which attracts short sellers into the market.
And that’s not all because traders who bought previously will look to take profits which puts additional selling pressure.
Now here’s the thing:
Just because the market is “expensive” or there’s profit-taking doesn’t mean we blindly short the markets because it could expose us to huge risk.
So, what now?
Well, this is where the break of structure comes into play.
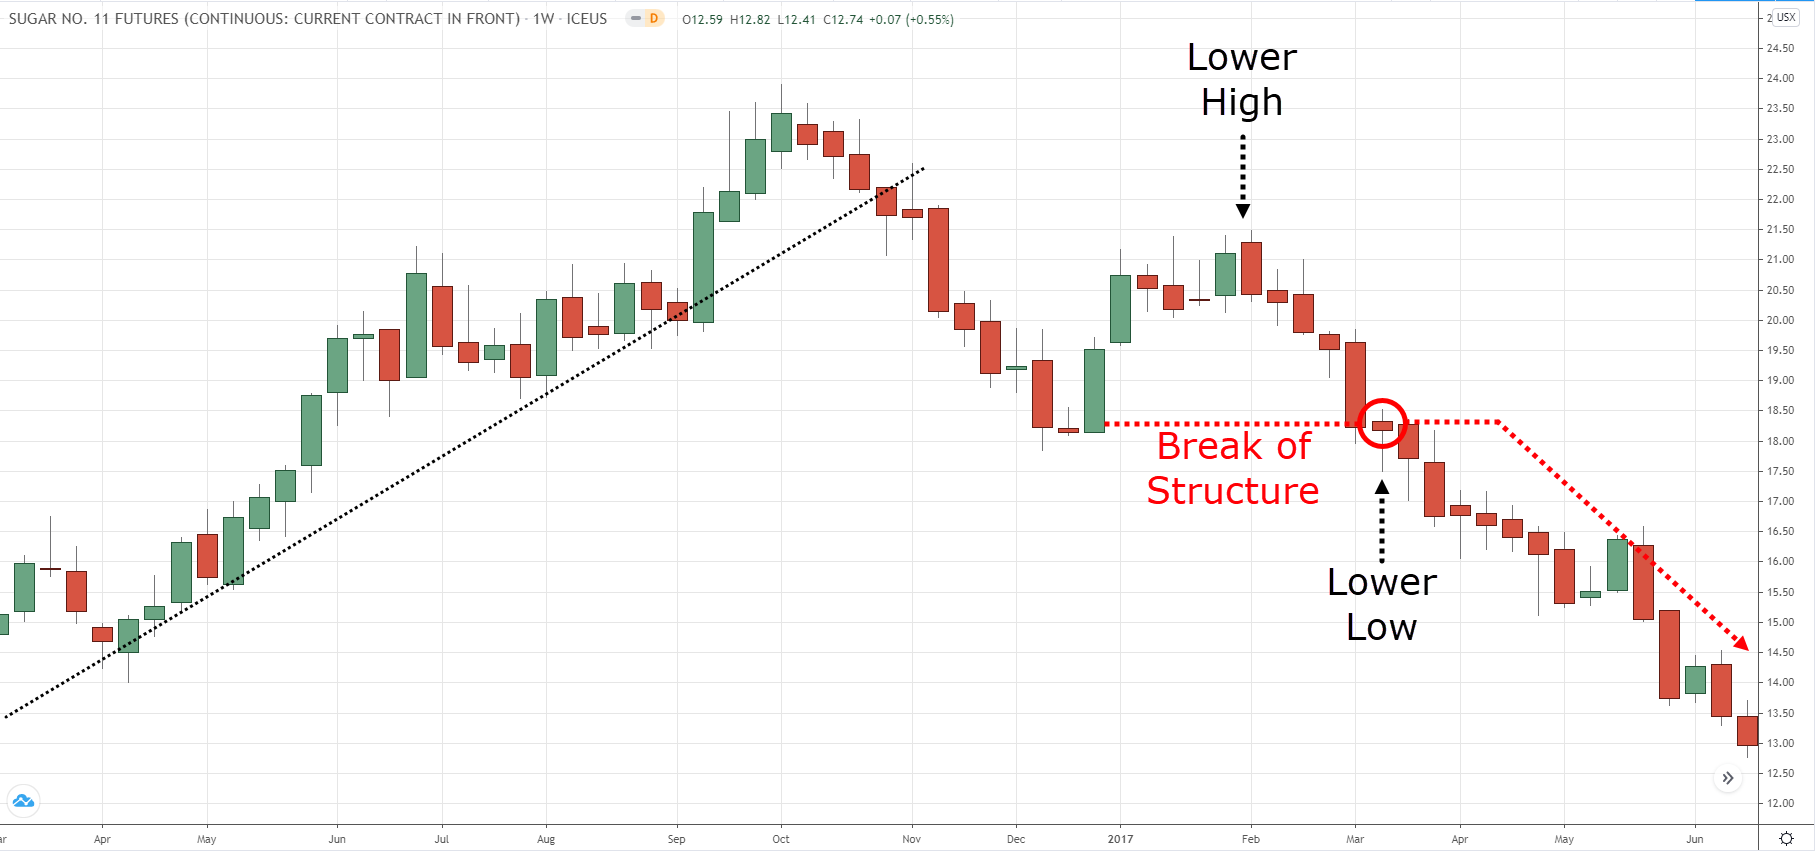
Here’s what to look for:
- An uptrend approaching resistance which can be seen on the higher timeframe (you want the resistance area to attract attention from the sellers on the higher timeframe)
- The price fails to make a higher high but instead, made a lower high (this gives us a reference point to set our stop loss)
- Go short on the break of swing low or support
(And vice versa for a long trade)
Here’s an example:
Pro Tip:
On the trending move, you want the range of the candles to get smaller to signal that the buyers are getting weak.
And on the retracement move, you want the range of the candles to get larger to signal that the sellers are stepping in.
If you want to learn more about trending and retracement moves, then go read The Complete Guide to Candlestick Chart.
Price action pattern #3: Breakout with a buildup
The breakout with a buildup is a price action pattern which helps you identify high probability breakouts.

Here’s the idea behind it…
Imagine, the price rallies into resistance and then starts to consolidate.
Bearish traders will short the market because the price is at resistance (as that’s what most textbooks would teach you).
So, they go short and set their stop loss above the highs of resistance.
Now, as the market consolidates longer, more traders will go short—which means more buy stop orders (stop loss from short traders) will accumulate above the highs of resistance.
At this point, you have two things going in for you if you were to buy a breakout of resistance.
- If the price breaks above resistance, the cluster of buy stop orders will fuel more buying pressure (as short traders scramble to exit their trade)
- You can reference the lows of the consolidate to set a tighter stop loss (which offers favorable risk to reward on your trade)
Make sense?
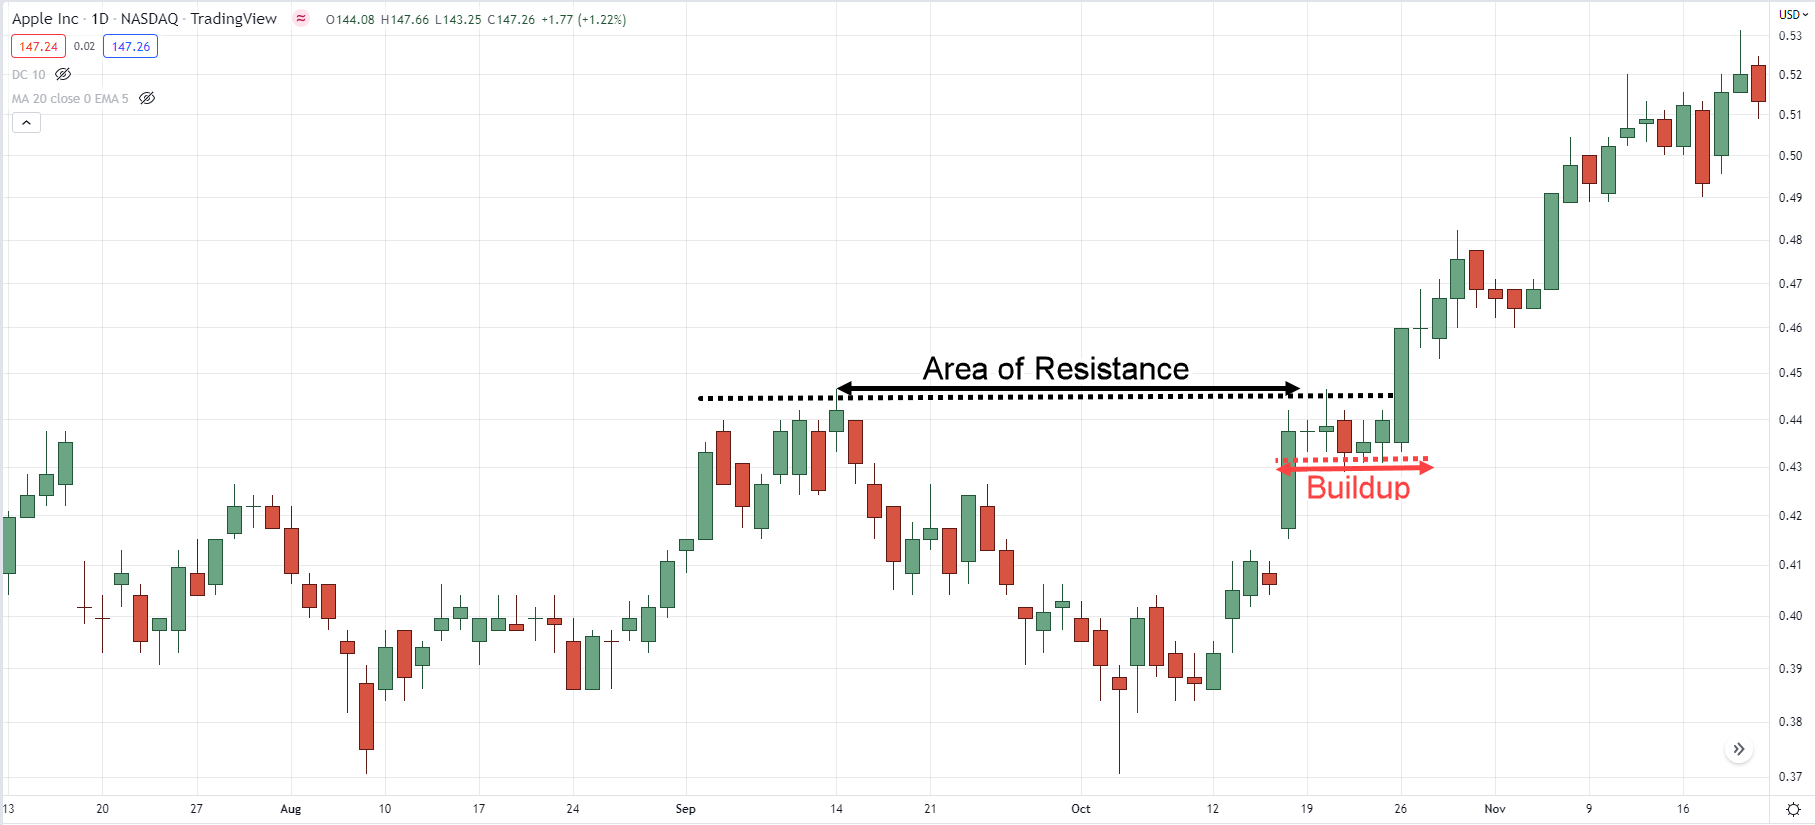
Then here’s how to spot the breakout with a buildup…
- The market is in a range for at least 80 candles or more (the longer the market ranges, the harder it breaks)
- The price forms a buildup (or consolidation) at resistance (the tighter the range of the candles, the better)
- The 20-Period Moving Average rises to touch the lows of the buildup (a signal that the market is ready to make a move)
- Go long when the price breaks above resistance
(And vice versa for a short trade)
Here’s an example:
Moving on…
Price action pattern #4: First pullback
The first pullback is a trend continuation price action pattern that allows you to capture the “meat” of the trend.

Here’s why it works…
Imagine, the price breaks above resistance with big bullish candles.
For the early buyers, some of them will book their profits which puts a little selling pressure in the market (and the price stalls).
When this happens, counter-trend traders will think the market is “too high” and about to reverse lower, so they go short and have their stop loss above the swing high.
Now if the market collapses lower, then counter-trend traders will make a profit.
But if the trend continues higher, the cluster of stop loss above the swing high (from counter-trend traders) gets triggered which exerts buying pressure.
That’s not all, because traders who missed the earlier breakout will want to get a piece of the action, so they’ll buy the breakout of the swing high (which adds more fuel to the rally).
So if you’re reading this now, then you want to be the astute trader who buys the breakout of the swing high so you can capture the next burst of momentum.
So, here’s what to look for…
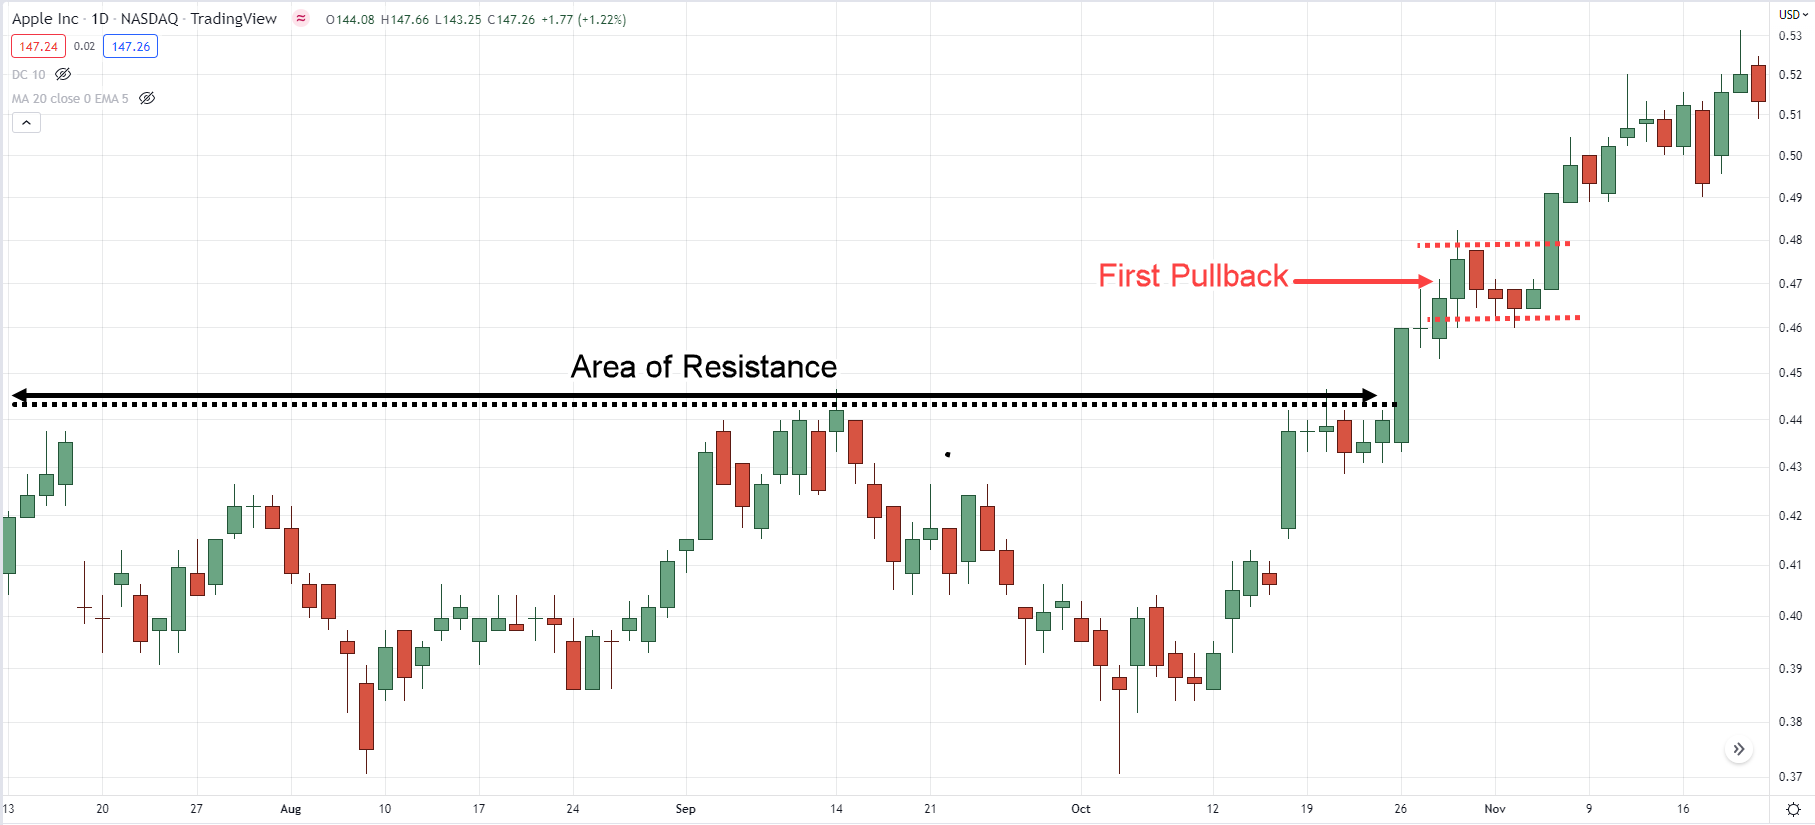
- The market broke out of resistance area and makes the first pullback
- On the pullback, the range of the candles are smaller compared to the breakout move
- The 20-period Moving Average has caught up with the price (touching the low of the pullback)
- Go long when the price breaks above the swing high
(And vice versa for a short trade)
Here’s what I mean…
Next…
Price action pattern #5: Break and re-test
The break and re-test is a trend continuation price action pattern which allows you to hop onto an existing trend, with low risk.

Here’s why it works…
When the price hits resistance, there will be bearish traders who will short the market.
Now if the price breaks above resistance, this group of short traders will be in the red and the smart ones will immediately cut their loss.
However, the stubborn ones will hold onto the trade and pray for the market returns back to their entry price.
If that happens, they will exit their trade at breakeven which puts buying pressure in the market (as they need to buy to cover their short position).
With this in mind, you can look for buying opportunities at previous resistance which could become support—so you can get a low-risk entry into the existing trend.
Here’s what to look for:
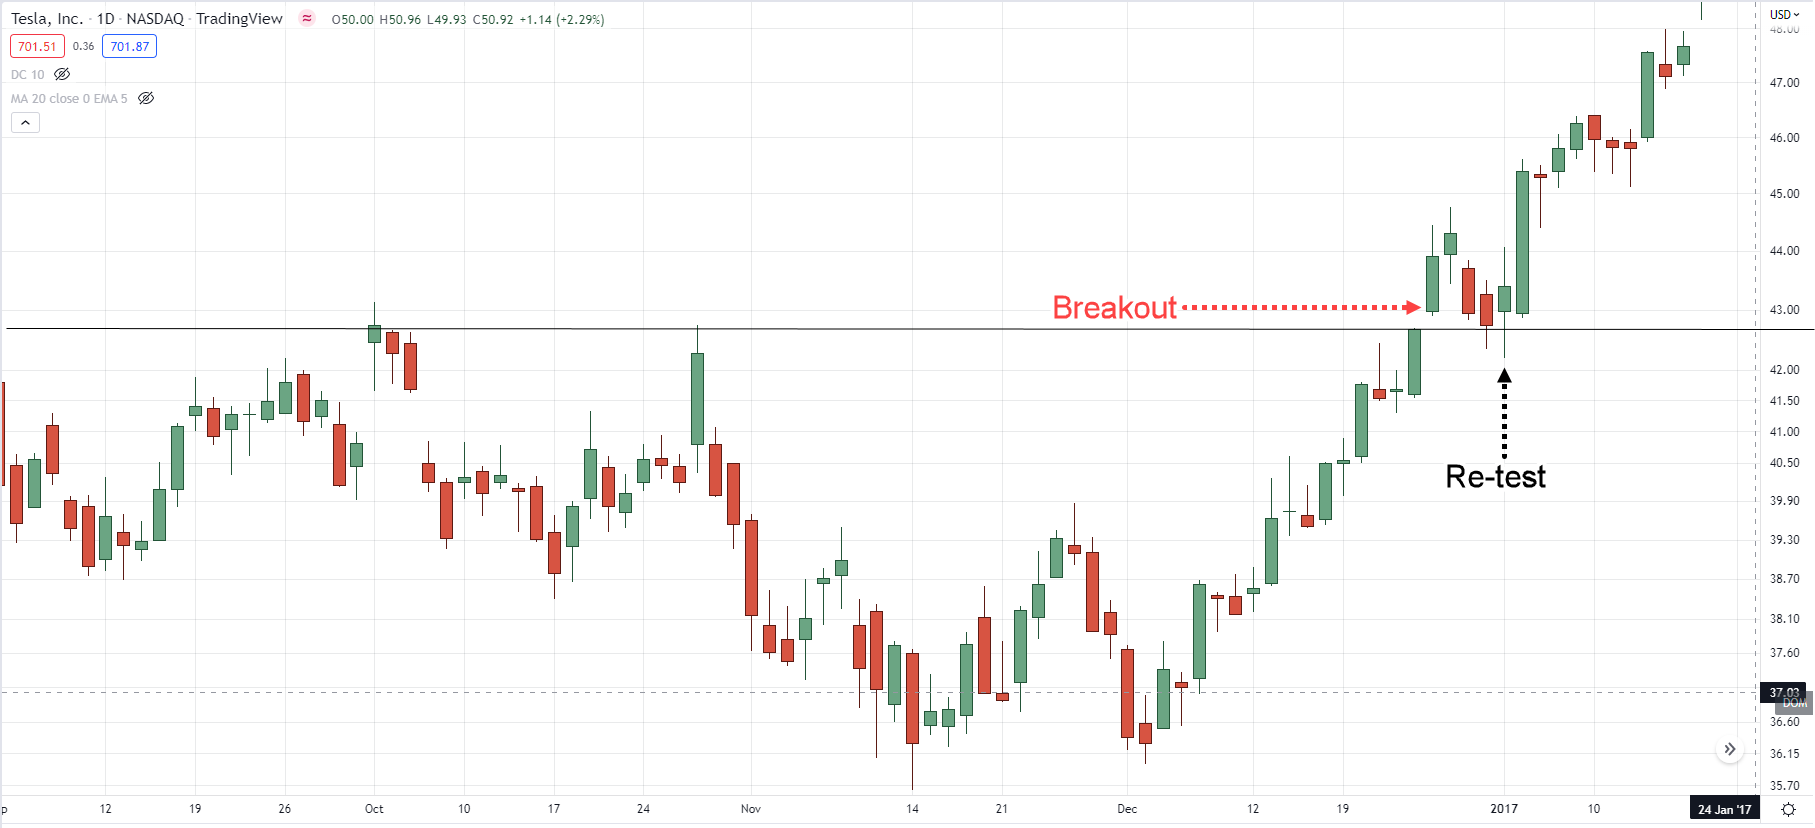
- The market broke out of resistance and makes a pullback towards the breakout level (where previous resistance could become support)
- The price re-test the breakout level and forms a bullish candlestick pattern (like a hammer, bullish engulfing, etc.)
- Go long on the open of the next candle
(And vice versa for a short trade.)
Here’s an example:
At this point:
You’ve discovered 5 powerful price action patterns that work and how to trade them step by step.
But, if you want to find the highest probability price action pattern, then you must consider the context of the market and that’s what I’ll cover next…
Trade near the higher timeframe area of value, not far from it
I know this sounds confusing, so let me explain with a few charts.
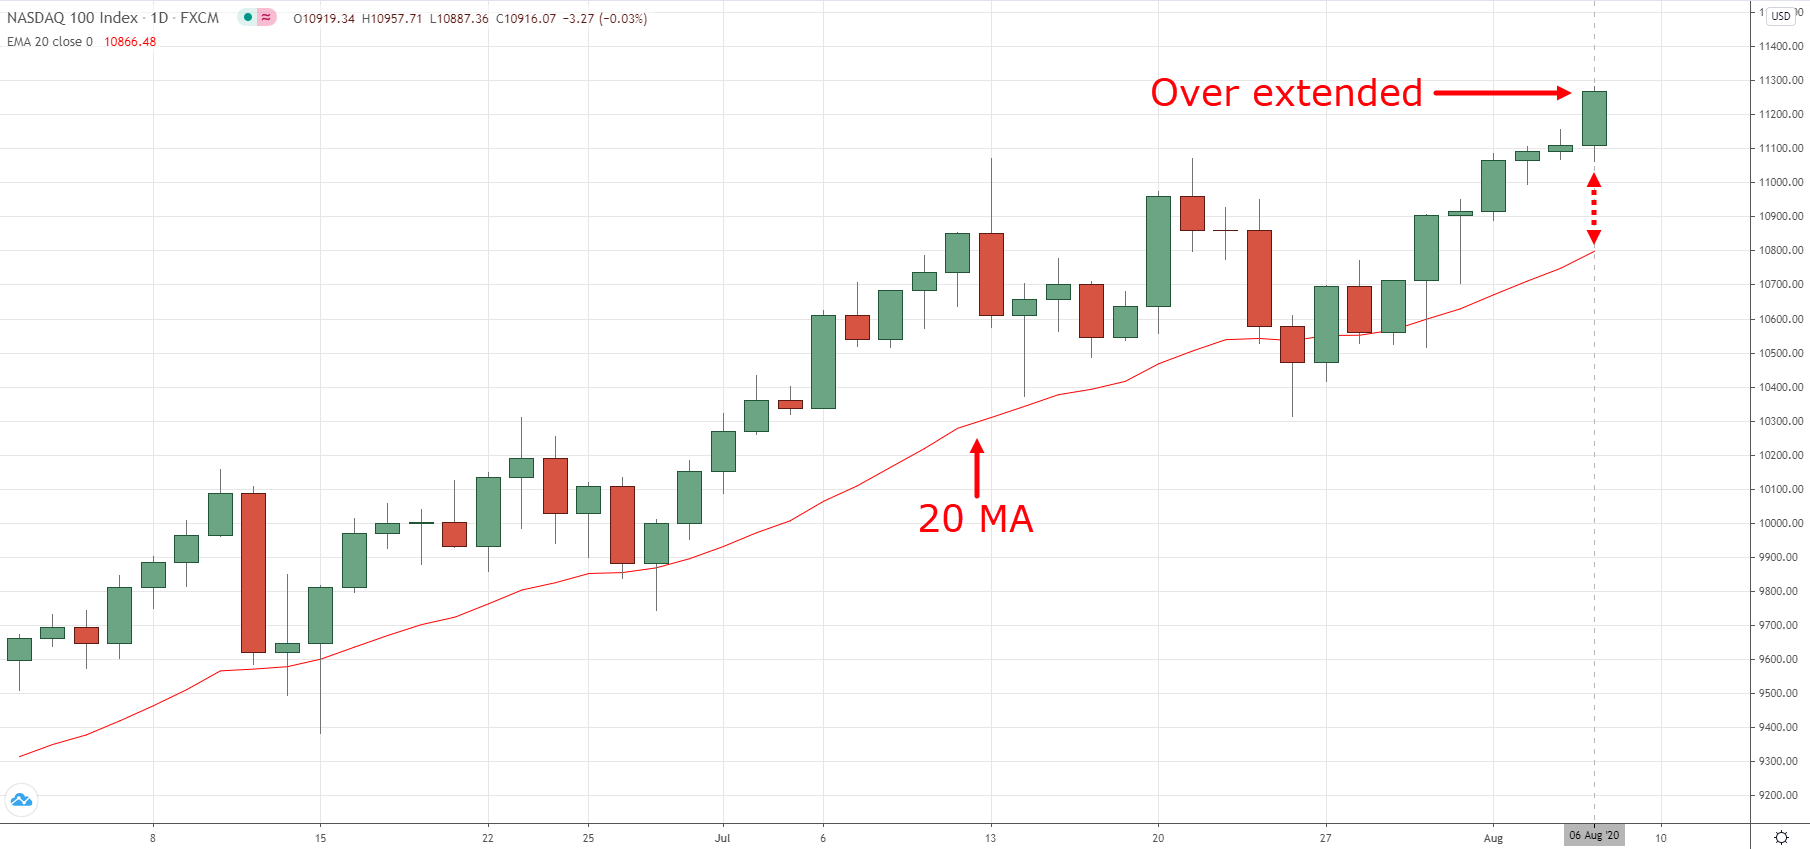
Look at the chart of Nasdaq below:
Nasdaq (Daily) is in an uptrend and the area of value is around the 20-day Moving Average where it has bounced off multiple times.
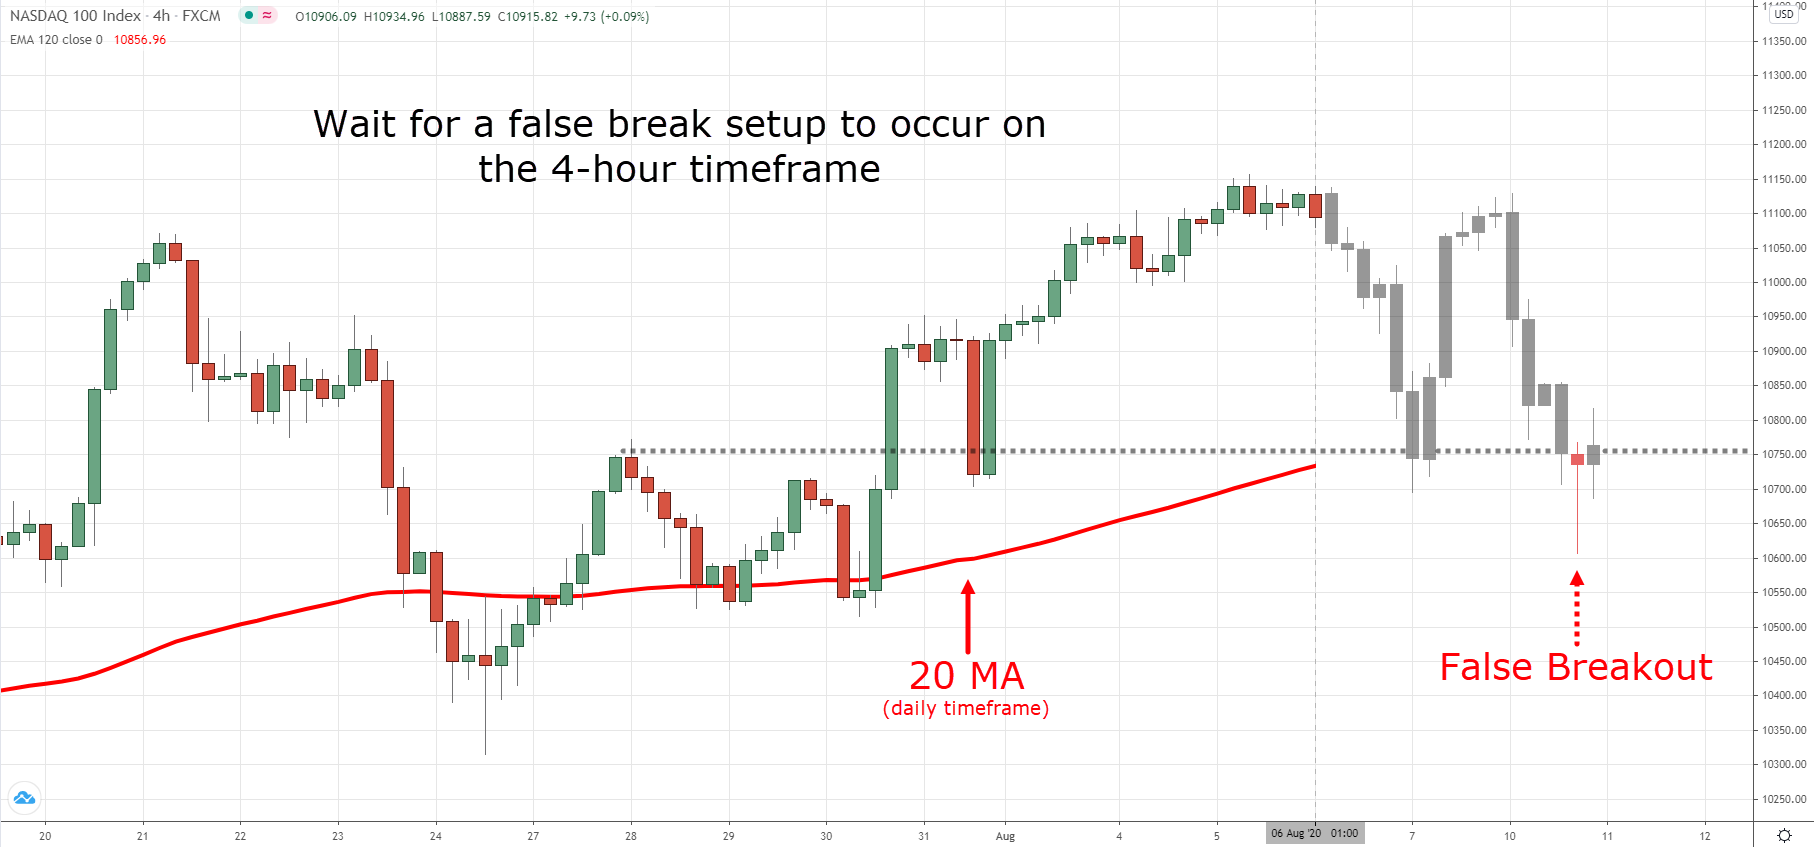
At this point, the price is a distance away from the 20-day Moving Average. So, if you were to have a false break setup on a lower timeframe (like 4-hour) to go long, you want to avoid it.
An example:
Now you’re probably wondering:
“Why is that?”
Simple.
Because this market tends to retrace towards the 20-day Moving Average (the area of value), and it could do so again and reverse higher from there.
So, a much better setup would be for the false break setup (on the 4-hour timeframe) to coincide with the 20-day Moving Average as you have the area of value on the higher timeframe working in your favour—not against it.
Cool?
Price structure confluence: How to find low risk and high reward trading setups (95% of traders miss this out)
Here’s a pop quiz for you, which of these 2 events is more significant?
- Your wife’s birthday
- Your wife’s birthday which coincides with Christmas—and also happens to be your wedding anniversary
You’d go with #2, right?
Because there are multiple “events” coming together and that attracts more attention—which makes that day even more special!
Now, you’re probably wondering:
“What has this got to do with trading?”
Well, the concept is the same!
When you trade from an area of value that coincides with a higher timeframe support/resistance, it makes it even more “powerful”.
Want an example?
Great. Here you go…
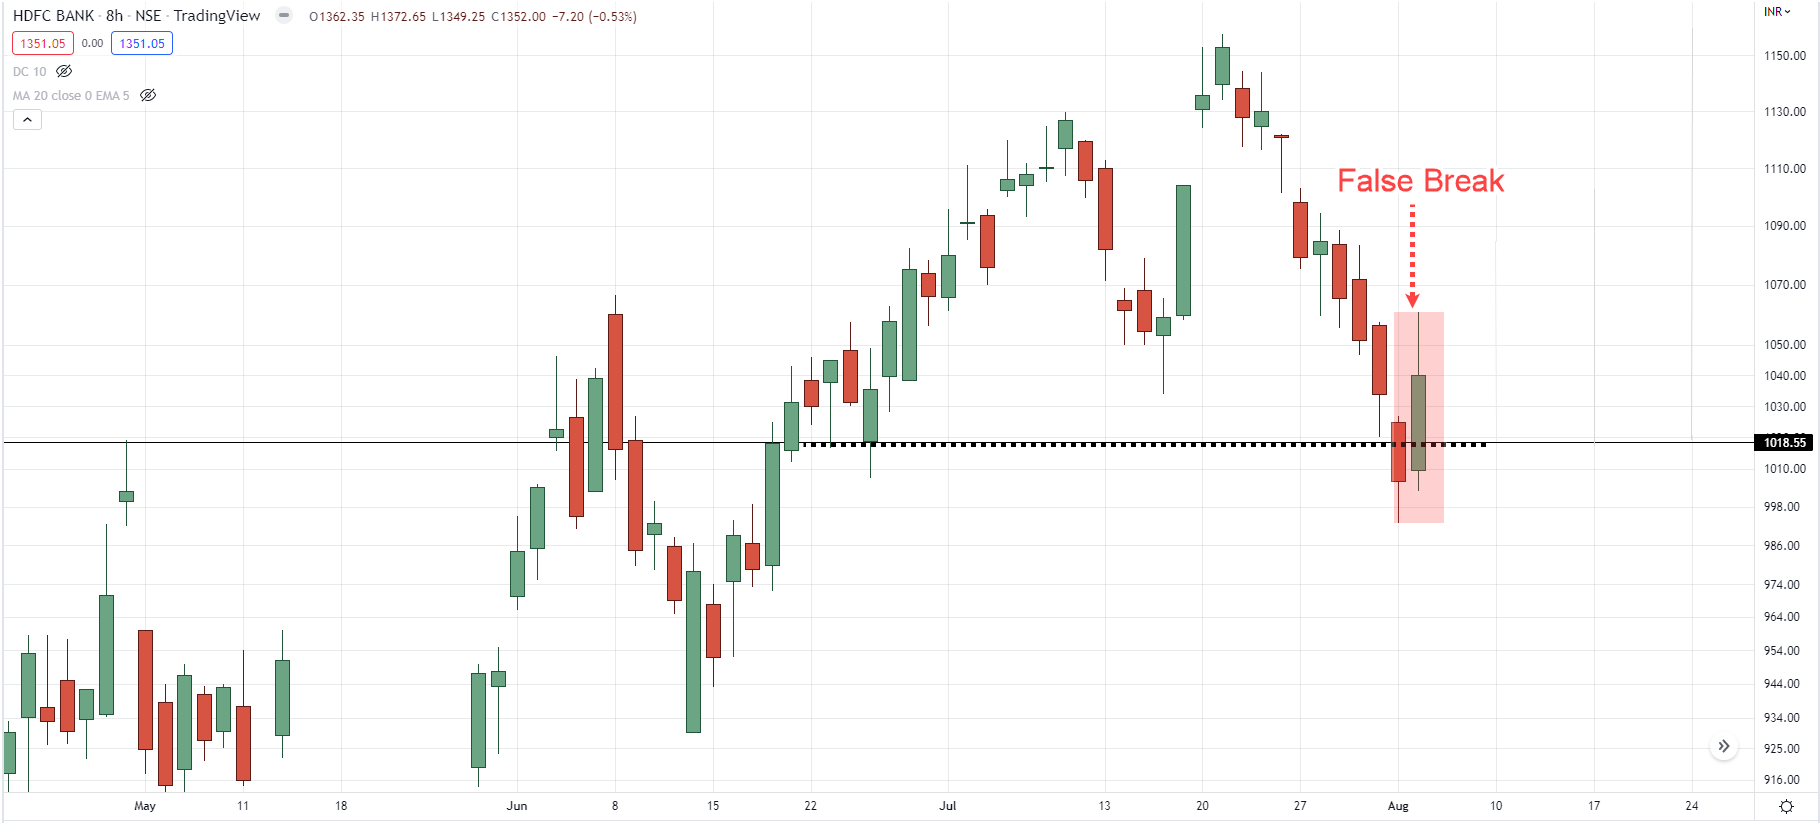
Here’s a chart HDFC BANK on the 8-hour timeframe:
Now you’re probably thinking…
“Who in the right mind wants to be buying right now?”
Well, if this is the only chart I have, then I won’t be interested to buy either.
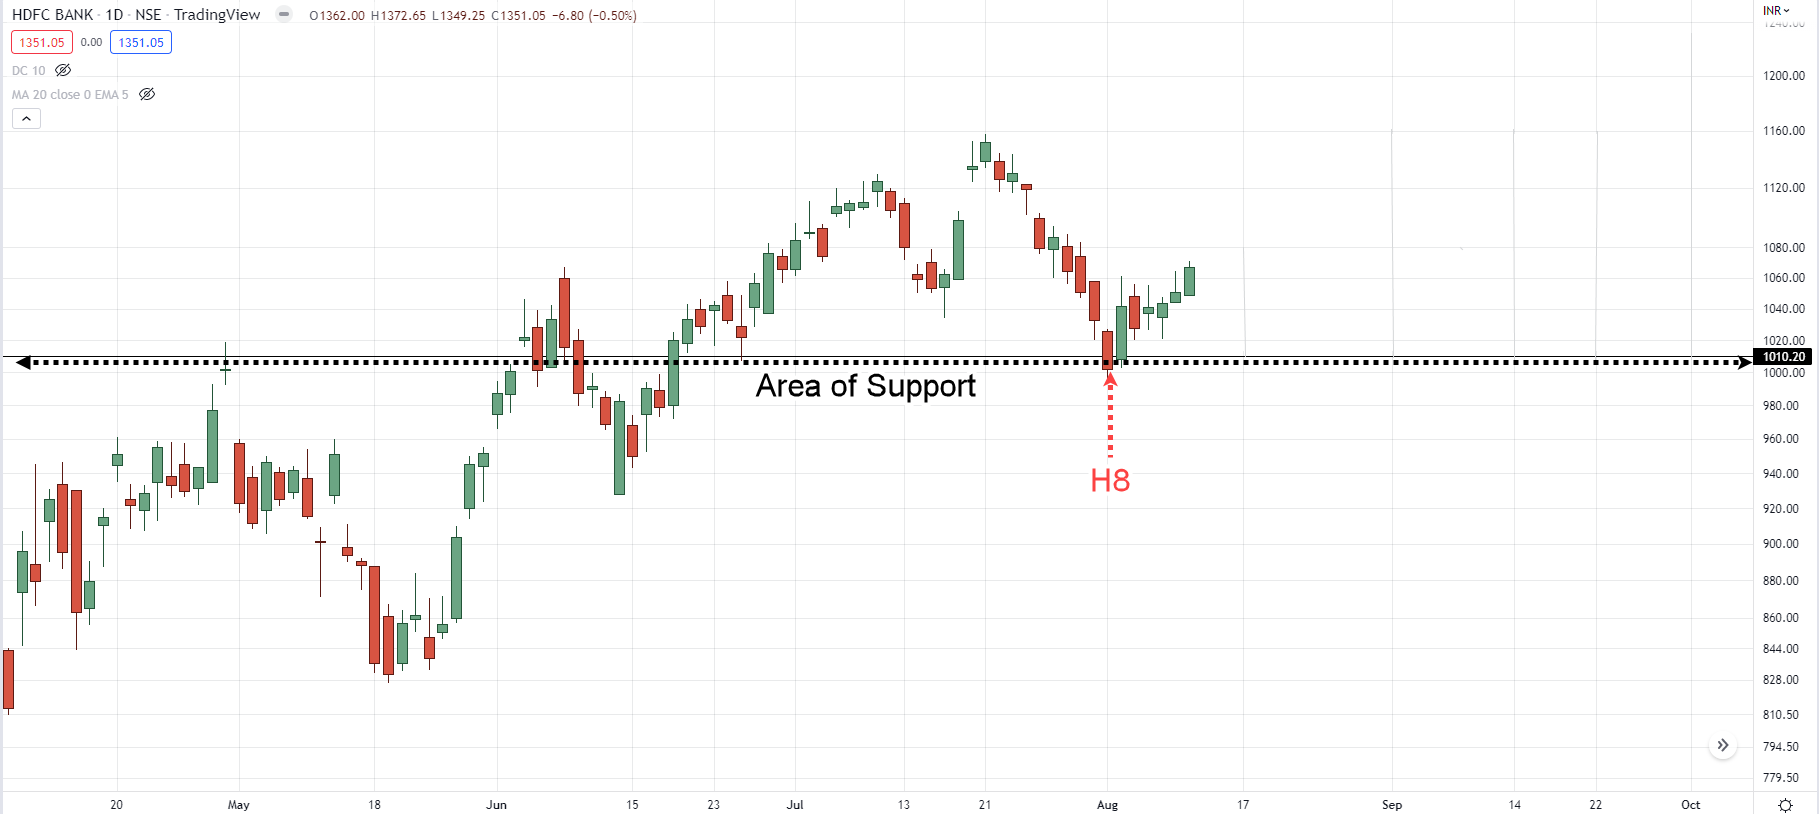
But, if you realize the 1010.20 area is a support area on the daily timeframe, then it changes everything.
Here’s what I mean…
As you can see, the daily timeframe is in an uptrend and the 1010.20 is an area where previous resistance could become support.
What you saw earlier on the 8-hour timeframe is a false break price action pattern which offers you a low-risk entry to hop on board the daily trend.
If the price re-tests the swing high on the daily timeframe (around 1160.00), that’s a potential 149 pips move.
Can you see how powerful this is?
Conclusion
So here’s what you’ve learned today:
- False break is a reversal price action pattern which allows you to buy low and sell high
- Break of structure is a reversal price action pattern which allows you to enter the start of a new trend (with low risk)
- Breakout with a buildup helps you identify high probability breakout trades
- First pullback is a price action pattern that allows you to capture the “meat” of the trend
- Break and re-test allows you to hop onto an existing trend with low risk
- The best trading setups lean against the higher timeframe area of value (like support & resistance, moving average, trendline, etc.)
Now here’s what I’d like to know…
Which is your favorite price action pattern and why?
Leave a comment below and share your thoughts with me.


My favourite is breakout with a build up. It’s worked well for me
Awesome, thanks for sharing your experience Nkosinathi!
Well well. I wouldn’t say I have a favorite because all them makes a lot of sense and I am definitely inculcating them into my trading plans. Thanks for sharing . Experience will always be the best teacher 🫶❤️.
You’re welcome, Carlos!
My two techniques are break and retest strategy ,,, then I trade reversal that goes along the trend…..
Thanks for sharing, Orloba, let us know how it goes!
Thank you Rayner I ve learn a lot from read your books t..thank you for the tips you are sending me God bless you!!
Great to hear that Davidson, you’re welcome!
Breakout
You got it, Richard!
First pull back is my favorite because it turns up to align with snipers move
Thanks for sharing, Akonnor!
Hi, first of all thank you for being a great teacher! I have learnt a lot from you. No favorites, all of them are great at different points in the market but if I need to pick one its gonna be BAWB!
Thank you for sharing, Nandan, the BAWB will surely do you well!
Break and retest
Thanks for sharing, Bama!
Pin bar pattern at an area of value in a trending market, it’s a high probability setup and works most of the time 👌
Awesome!
Thanks for sharing, Tefo!
I am a momentum trader. Breakout with a buildup is suitable for me. I like it in 4H timeframe in FOREX market.
Awesome, thanks for sharing, Habib!
Break and retest. Thanks for the great impact of knowledge.
Great, thanks for sharing, Godwin!
Thank you for this Sir!!
As for my favorite, I’d say all of them are great but false break and break of structure do work for me pretty well !!
Great to hear that it’s working pretty well for you, Jeancy!
Everything 👌I’ve been studying financial markets 2 weeks now. Your books and videos helps me alot 🤗 No youtuber and trader could beat you Rayner! You explained anything soo clear. Thank you so much. Please don’t get tired of sharing your ideas and knowledge regarding to Financial markets specially crypto sphere. Sending Love and Support from Philippines 🇵🇭
We’re delighted to hear that Antonette, you’re welcome!
Really nice mr rayner thinks a lot I it’s more useful than we think
Love u from Afghanistan 🇦🇫
Great to hear that Rashid, sending loves from Singapore!
I love the price action pattern that tells us to trade near area of value of higher time frame
It works for me alot😇
And also the other price action patterns submit to this one.
Thanks for sharing, Akpan!
I always trade the false breakout. It is easy to identify once you can read between the lines. Ensure couple of rejections at resistance and employ the behaviour of candle stick to time your entry.
Thanks for sharing, Okoro!
The Break of structure pattern. I like it because of it’s simplicity and high reward.
Since I watch ( Trending move, retracement move and break of structure inconjunction with price leaning on higher timeframe area of value), trend reversal trading become one of my best setups. I noticed that when I’m to trade trend reversal on the daily timeframe,at the same time,ascending triangle is spotted on the 4hr timeframe. So I can either buy the break of structure on the daily timeframe or buy the breakout of the 4hr timeframe using daily timeframe to set SL/TP. Its just beautiful.
Awesome, thanks for sharing Mohammed!
I appreciate your daily information.
You’re welcome, Emmanuel!
Breakout with buildup, but also breakout with first pull back look perfect for me to know the trend softly
Awesome, thanks for sharing, Zubery!
I wanna be a part of this
And I would love to do this this job is really impressive
Keep up the practice and keep on applying, Sani!