The Keltner Channel is a simple but powerful trading indicator.
It helps you better time your entries, improve your winning rate, and can even “predict” market turning points.
And if you want to learn how to do it, then today’s post is for you.
But first…
What is a Keltner Channel and how does it work?
The Keltner Channel is an Envelop-based indicator (others include Bollinger Bands, Donchian Channels, etc.).
This means it has an upper and lower boundary to help you identify potential “overbought and oversold” levels.
Note: The Keltner Channel used in this post is the modified version by Linda Rasche.
Now, the default Keltner Channel settings have three lines to it:
- Middle Line: 20-period Exponential Moving Average (EMA)
- Upper Channel Line: 20 EMA + (2 * Average True Range)
- Lower Channel Line: 20 EMA – (2 * Average True Range)
You can think of the Middle Line as the mean.
And the Upper and Lower Channel Line shows you how far the price is away from the mean.Yerve
Here’s how it looks like…

Pro Tip:
If you use TradingView, you can find the Keltner Channel under the “Indicators” tab…
Keltner Channel vs Bollinger Bands, what’s the difference?
The difference is the way Channel Lines are calculated.
Keltner Channel uses Average True Range and Bollinger Bands uses Standard Deviation.
And if you compare the two, you’ll realize Keltner Channel is “smoother” compared to Bollinger Bands.
Next…
Don’t make this common mistake when using the Keltner Channel indicator
Here’s the deal:
You don’t buy just because the price is at the Upper Keltner Channel.
Why?
Because in a strong uptrend, the price can remain “overbought” for a long period.
(And vice versa for a downtrend.)
Here’s what I mean…
Continuously overbought levels at NVIDIA Daily timeframe:

So now the question is:
How do you use the Keltner Channel?
Well, that’s what I’ll cover next.
Read on…
How to use Keltner Channel to “predict” market turning points
Here’s something you might not know…
Price reversals usually occur when there’s an extreme move into market structure (like Support or Resistance).
You’re probably thinking:
“But how do I identify an extreme move?”
That’s where Keltner Channel comes into play.
All you need to do is, look for the price to close outside the Keltner Channel.
This tells you the price is at an extreme level — far from the mean.
An example…
Closed outside the Keltner Channel at NVIDIA Daily timeframe:

Now before you think…
“Oh, the price has closed outside of the Lower Channel Line. Time to buy!”
Not so fast, my young padawan.
Recall:
In a strong downtrend, the market can “hug” the Lower Channel Line for a long period.
That’s why you need another signal to tell you the market is likely to reverse higher.
So, what is it?
Price rejection at market structure.
This means you want the price to come into Support and Resistance and get rejected from it.
Here’s an example…
Price rejection at support on NVIDIA Daily timeframe:


Now if that’s a lot to swallow, then here’s a quick recap…
- The price closes outside of the Lower Keltner Channel Line
- The price is at Support
- You get strong bullish price rejection (like Hammer, Bullish Engulfing Pattern, etc.)
- And vice versa for short setups
Does it make sense?
Great!
Then let’s move on…
Keltner Channel: How to identify different market conditions and improve your winning rate
I’m sure you agree the market is always changing — it can be in an uptrend, downtrend, or range.
On hindsight, it’s easy to identify the current market condition.
But in real-time, things are a lot more difficult, right?
Well, the good news is…
You’re about to learn a technique to help you identify market conditions in real-time so you can improve your winning rate.
Here’s how…
Insert the Keltner Channel and 200-period Moving Average on your charts.
Now, you’ll see one of three things…
- If the entire Keltner Channel is above the 200MA, then the market is in an uptrend
- If the entire Keltner Channel is below the 200MA, then the market is in a downtrend
- If the 200MA is inside the Keltner Channel, then the market is in a range
Here’s an example of an uptrend on NVIDIA Daily timeframe:

Here’s an example of a range market on Tesla Daily timeframe:

So how do you make use of this information?
Simple.
If the market is in an uptrend, you look to buy.
If the market is in a downtrend, you look to sell.
If the market is in a range, you can “buy low and sell high” within the boundaries of the range.
Next…
Keltner Channel Squeeze: How to identify explosive breakout trades about to occur
Here’s something you might not know…
The volatility of the market moves in cycles, from a period of low volatility to high volatility and vice versa.
This means the best time to do it is when the volatility of the market is low.
You might be wondering…
“But how do I tell when the market’s volatility is low?”
There are different ways, but one approach is using the Keltner Channel.
Here’s how…
- Let the price come near to Support and Resistance
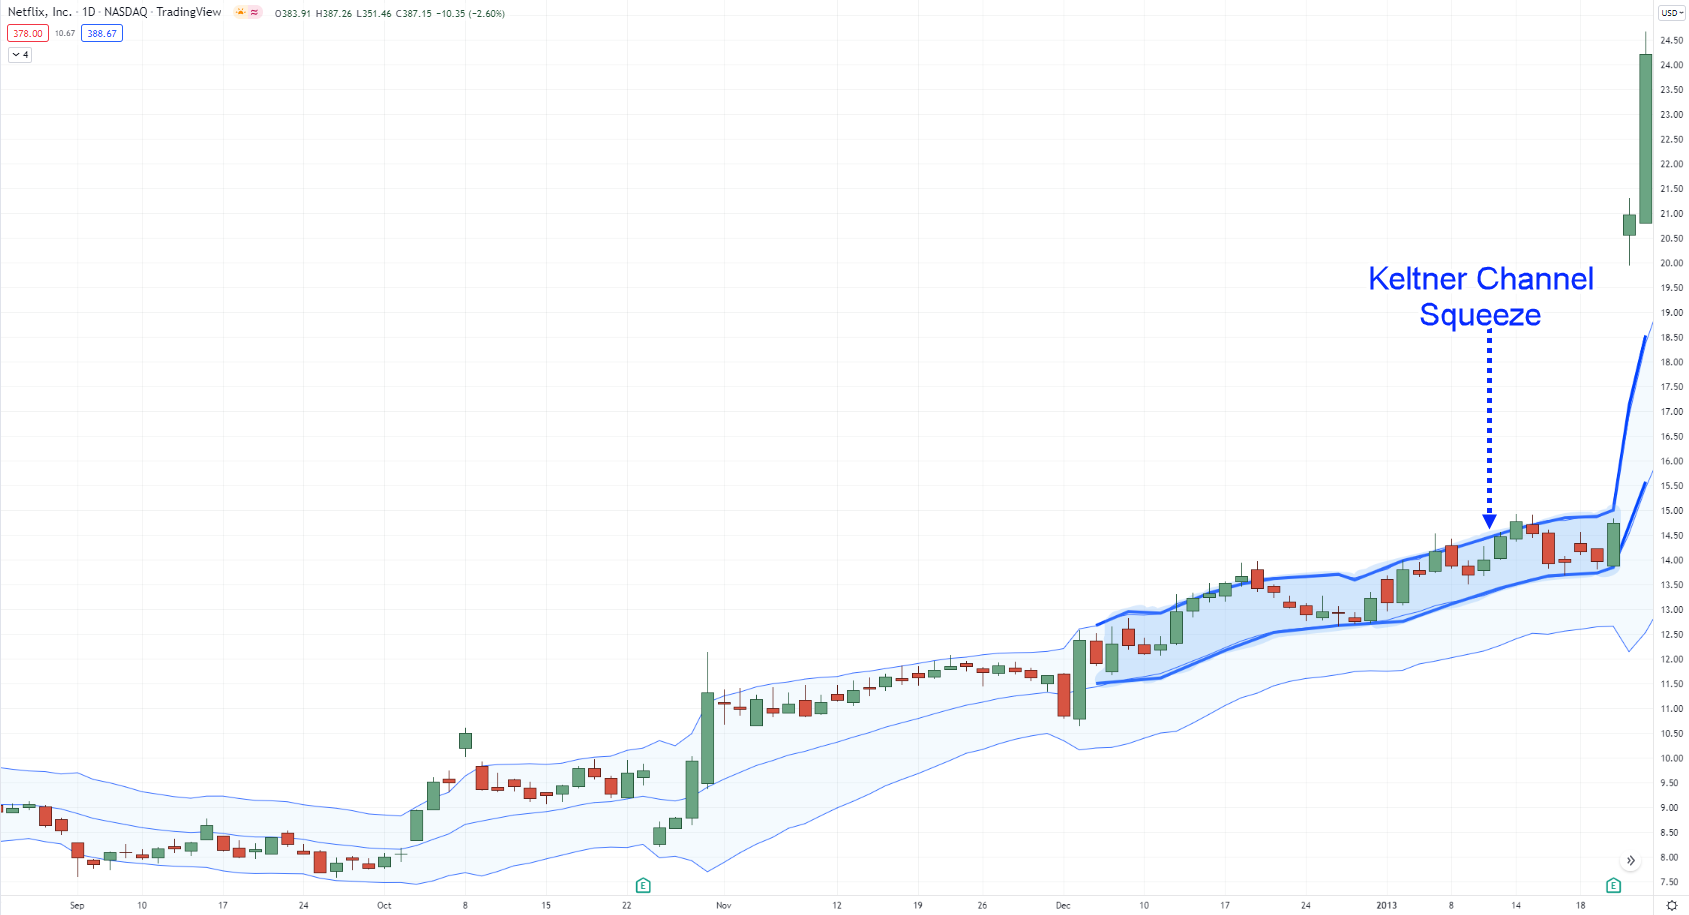
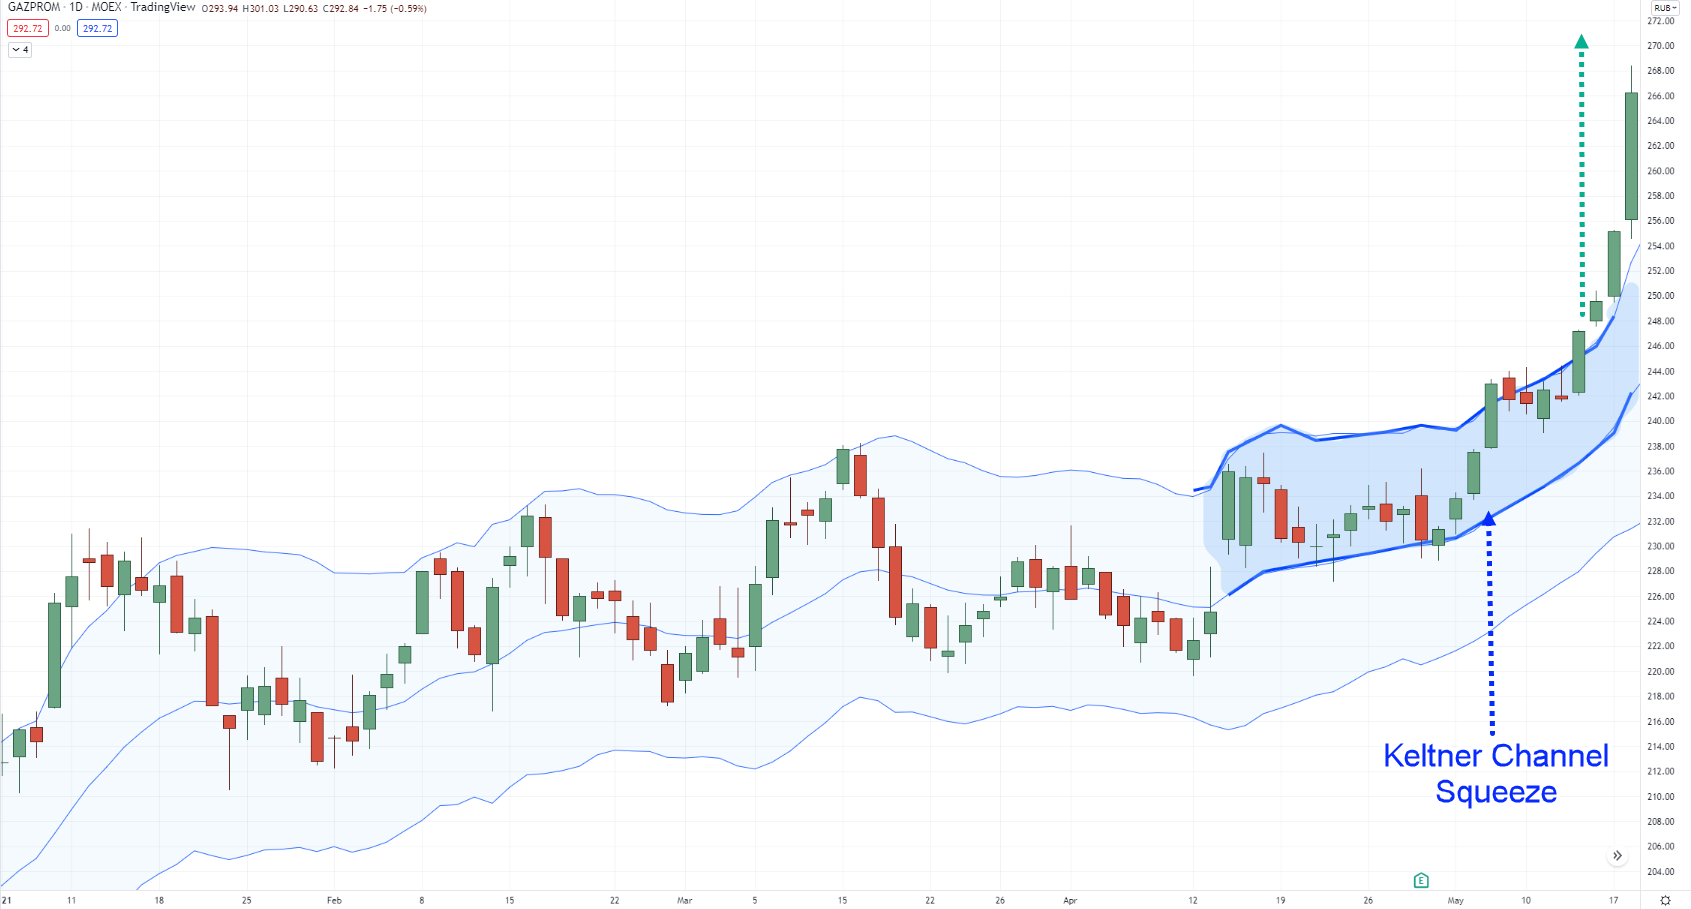
- Wait for a Keltner Channel Squeeze (the price gets “trap” between the outer and middle channel line)
- Enter on the breakout
Here are a few examples…
Keltner Channel Squeeze on Netflix Daily timeframe:

Another Keltner Channel Squeeze on GAZPROM Daily timeframe:

Now…
During the Keltner Channel Squeeze, the outer channel line is “close to flat” to signal indecision and low market volatility.
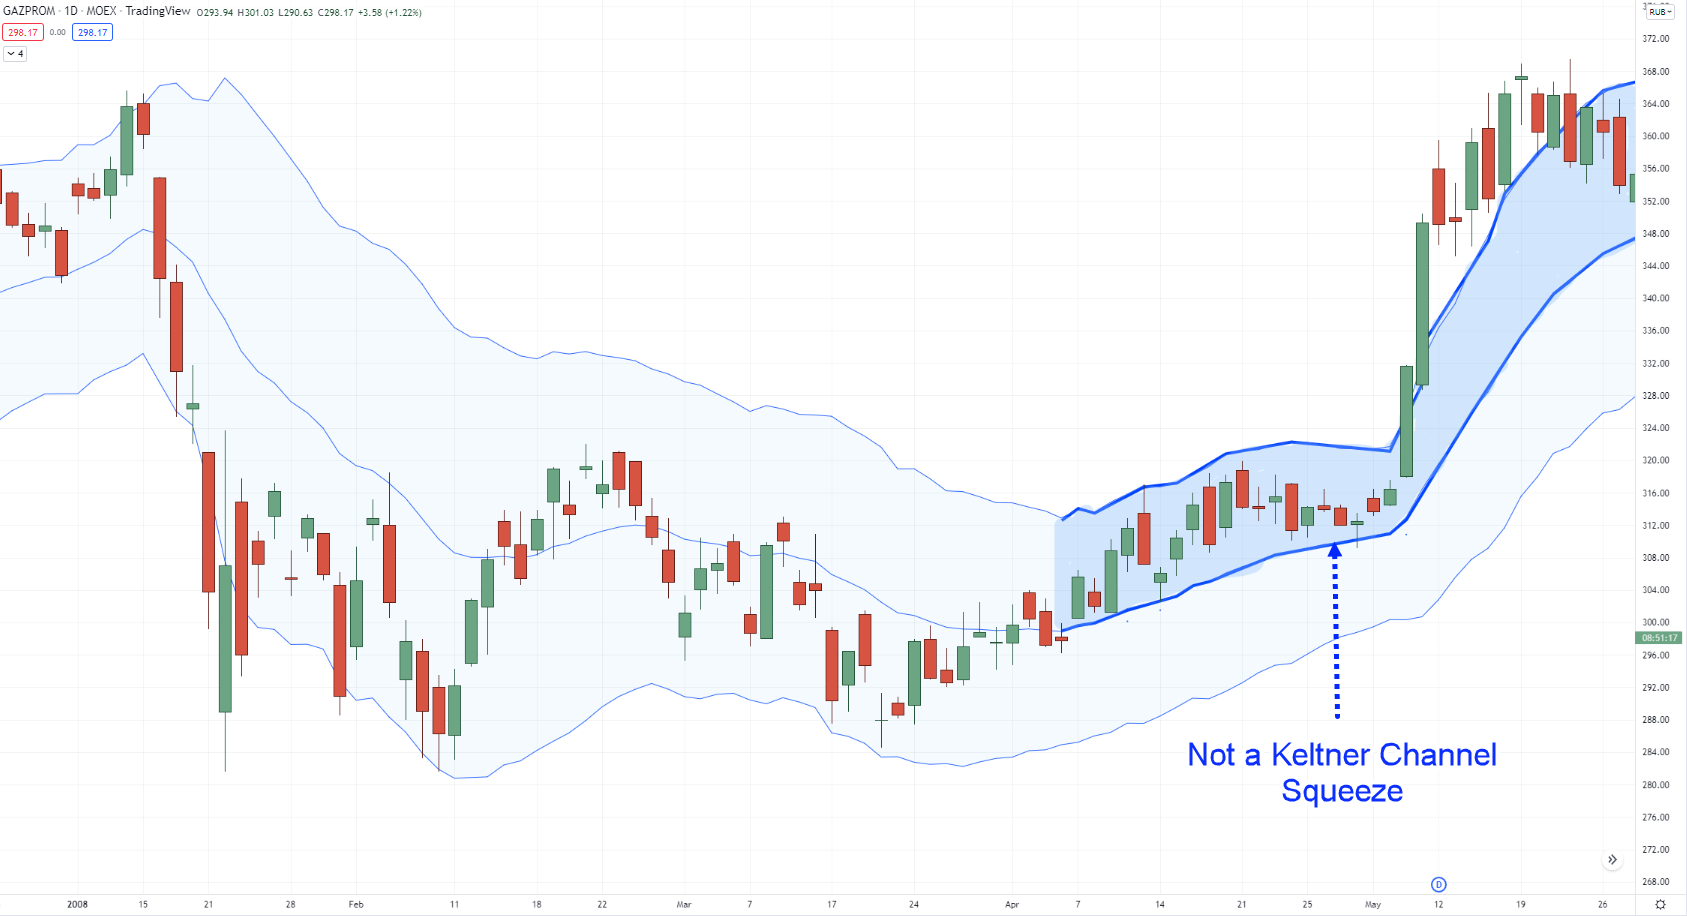
If the outer channel line is steep, it’s probably a strong trend and not a Keltner Channel Squeeze.
Here’s an example on GAZPROM Daily Timeframe…

Moving on…
How to better time your entries in a trending market
Trending markets are a different beast.
You can’t wait for the price to re-test Support and Resistance because it may never come (especially in strong trends).
So what now?
That’s where Moving Average comes into play.
Recall:
The Middle Channel Line of the Keltner Channel is actually a 20-period Moving Average.
So, if the price is consistently above (or below) it, it’s probably a strong trend and you can the 20MA to time your entry.
Here’s how…
- If the market is in a strong trend, then wait for a pullback towards the 20MA
- If there’s a pullback towards 20MA, then wait for a reversal candlestick patterns (like Hammer, Bullish Engulfing pattern, etc.) to signal an entry trigger
Here’s an example on Microsoft Corp. Daily timeframe…

Make sense?
Great!
Conclusion
So, here’s what you’ve learned today:
- The Keltner Channel is an Envelop-based indicator. It’s similar to Bollinger Band with an upper, middle, and lower Channel Line, but the way it’s calculated is different
- A price reversal is likely to occur when the price closes outside of the outer Channel Line and into key market structure (like Support and Resistance)
- If the price closes outside of the outer Channel Line, avoid trading in the same direction as it’s prone to a pullback (or reversal)
- A Keltner Channel Squeeze occurs when the price is contained between the 20MA and the Outer Channel Line — signaling the market is about to break out, soon
- You can use the Keltner Channel to time your entry in a strong trend — buying the breakout or trading the pullback
And there you have it!
A detailed guide on how to use the Keltner Channel like a pro.
Now, here’s what I’d like to know…
Do you use Keltner Channel in your trading? Why or why not?
Leave a comment below and share your thoughts with me.


Precise, practical and put to use immediately. Thank you!!
You’re welcome Navin!
I don’t, but may start now. Thank you.
You’re welcome Brye!
I use Bollinger band but I try this Keltner Channel. Thank you for much info.
Good luck Ver, you’re welcome!
I am a price action trader and only use MA as indicator. I learnt about price action trading from a certain Rayner Teo. Bless him! Thanks for this article, I’ll give this a try.
Feel free to keep us updated on how it’ll go!
Did not understand the use bedre. I think i hot the understanding now. Thanks a Lot .
Mick DK
We’re very delighted to hear that Mick!
Will the Kelter channel work for forex traders
Definitely!
Worth a try. I can drop my ordinary 20MA.
Feel free to do so Dan, but do keep in mind that the Keltner Channel already has moving average integrated to the indicator, might be too redundant to add another one!
No, I don’t use the Keltner Channel because this is the first time I ever heard of it. I am just beginning to show some profit just using the MA’s and support/resistance, so I don’t want to confuse myself using something new right now. I like to keep trading as simple as possible because I’m basically teaching myself even though I am a part of several trading groups and picking up bits and pieces of info along the trading journey. Thanks for the explanation of that tool.
That sounds good Barbara, learn at your own pace!
Every major turning point =
Top = upSwing Hits or close + KB – then PB’s & Reversal confirm by either a LH or HH that stays inside KB. Same for DT reversal : price DT low hits or close below KB – then Pb’s nside then uptrends to hit the ma or upper band – hi % uptrend if PB’s are HL’s
Thanks for sharing, DJ!
Thank you so much this is so helpful , I’m currently trading profitably after reading PATS and now with this Keltner channel indicator have high hopes my trading will even become much more better.
Great idea Muponda, price action first before indicators!
I am particularly wanting to trade Forex can this successfully be used to help me in that quest. Forex is not mentioned at all in the tutorial. Cheers G
Hey there Graham,
Yes, this concept also applies in the Forex markets!
Never heard of the Keltner channel till just now.
Always great to learn something new!
Rayner, Please share any Mean Reverting or Fade the Move strategy using Keltner Channel. Based on Volatility etc.
We’ll consider it Pratik!
You earlier posted about Donchian Channels. Which indicator (DC v KC) is more powerful or they work the same?
Hey there Clement, if you’re referring to the Keltner Channel then no, they work very differently!
First time that I am hearing of this Keltner channel, though I am a beginner in trading. Any one who assists the beginners?
Hey there Wonga, sure, feel free to ask us anything!
Thank you.you are nice person who is giving knowledge..
You’re welcome Arpit!
I had doubt about what value you put in Atr length…… I had already put 20…. What value we can put….
You are free to use 20 ATR, Suresh!
It is great explanation but sir can you explane how we can find this stock from our trading platform i.e. how to find stock by screener.
You can find this indicator via TradingView for free!
I agree with you. Need clarity on which time frame to use this indicator.Thank you.
The key is to choose which timeframe you can be consistent with!
No time frame is best . But 1hr -4hrs time frame is better for better information. Smaller time won’t give Betting clarity for break out. You know to enter a trade with keltner channel isn’t enough without understanding break out.
Thanks man .my eyes are open. You should have added a video though.lol
You’re welcome Seshie, and thank you for the suggestion!
I hope you give us information on liquidity soon
Thank you for the suggestion, Seshie!
Hi very good material may I get a PDF of this?
Hey there Jose, as of now we don’t have a PDF version of this article, but you’re free to refer back here anytime!