Do you trade breakouts?
Then you know breakout trading can be exciting.
The price quickly moves in your favor and make it seems like you’re printing money.
However…
Breakout trading can also be painful.
For example:
You notice the price breaking above Resistance.
The candles are big and bullish, so you go long.
But suddenly, the price does a 180-degree reversal.
And before you know it, you bought the highs and now you’re bleeding in the red.
Ouch.
So now you’re probably wondering:
“How do I filter for high probability breakout trades and know which are the ones to avoid?”
Well, that’s what you’ll discover in today’s post.
Or if you prefer, you can watch this training below…
Breakout Trading: What is it and how does it work?
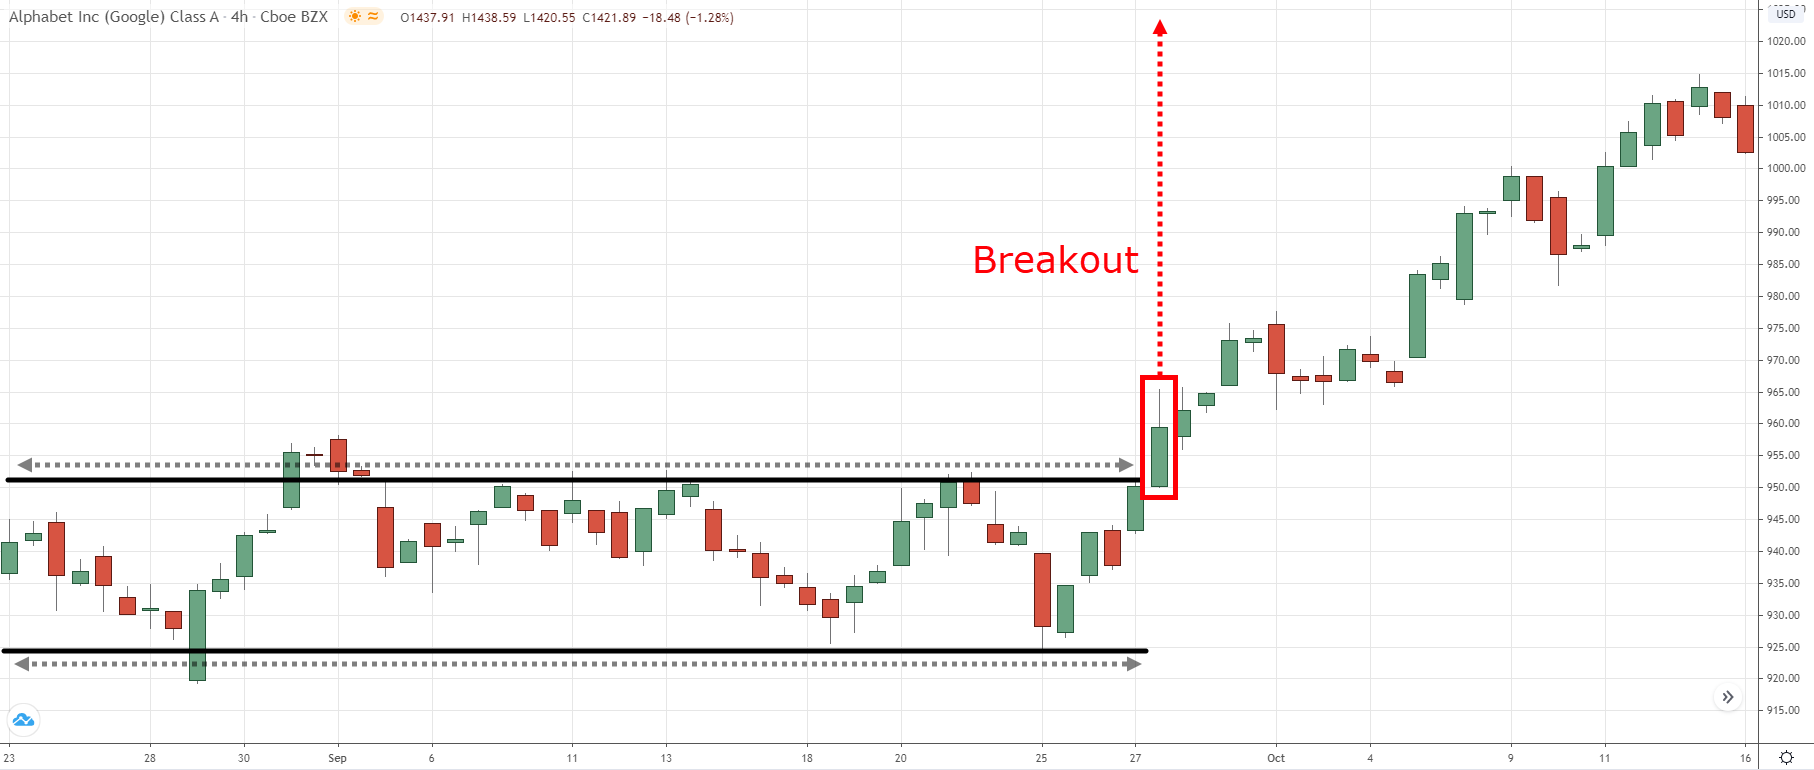
A breakout occurs when the price moves beyond a certain level.
So, breakout trading is entering trades when momentum is in your favor.
Here’s what I mean:
Now…
Breakout trading guarantees you catch every trend in the market — that’s why it’s widely used by Trend Followers, CTAs, and even Market Wizards.
I don’t buy stocks on a scale down; I buy on a scale up. — Jesse Livermore
Whatever method you use to enter trades, the most critical thing is that if there is a major trend, your approach should assure that you get in that trend. — Richard Dennis
If I were buying, my point would be above the market. I try to identify a point at which I expect the market momentum to be strong in the direction of the trade. — Ed Seykota
However, nothing is perfect.
And breakout trading has its pros and cons to it.
I’ll explain…
Pros:
• You’ll catch every trend in the market
• Momentum is in your favor
Cons:
• It could be a false breakout
• It can be psychologically difficult to enter the trade
I know…
Getting “caught” in a false breakout suck.
You feel like an idiot buying the highs only to watch the market do a sudden reversal.
That’s why in the next section, you’ll learn how to identify high probability breakout trades — and avoid the ones likely to fail.
Read on…
The WRONG way to trade breakout — you must avoid at all cost
I know.
It can be exciting to trade breakouts.
The price is moving fast, the candles are bullish, and momentum is in your favor.
However…
When it feels “right” to buy a breakout, it’s usually the worst thing you can do.
Why?
Because in the short-term, the buying pressure is exhausted and have no more “energy” to push the price higher.
So what happens?
The “smart money” starts to take profit.
Then, bearish traders will look to short the markets.
Slowly, the market starts to reverse…
At this point, traders who bought the highs are sitting in the red.
And when they can’t take the pain any longer, they cut their losses.
The result?
Increased selling pressure which causes the market to reverse lower.
So here’s the lesson:
Whenever the market looks very bullish — it’s usually too late to enter the trade.
My favorite way to trade breakouts (with low risk and huge returns)
So…
You’ve learned how NOT to trade a breakout.
Now, you’re probably wondering:
“So how should I trade breakouts?”
Well, my secret is this…
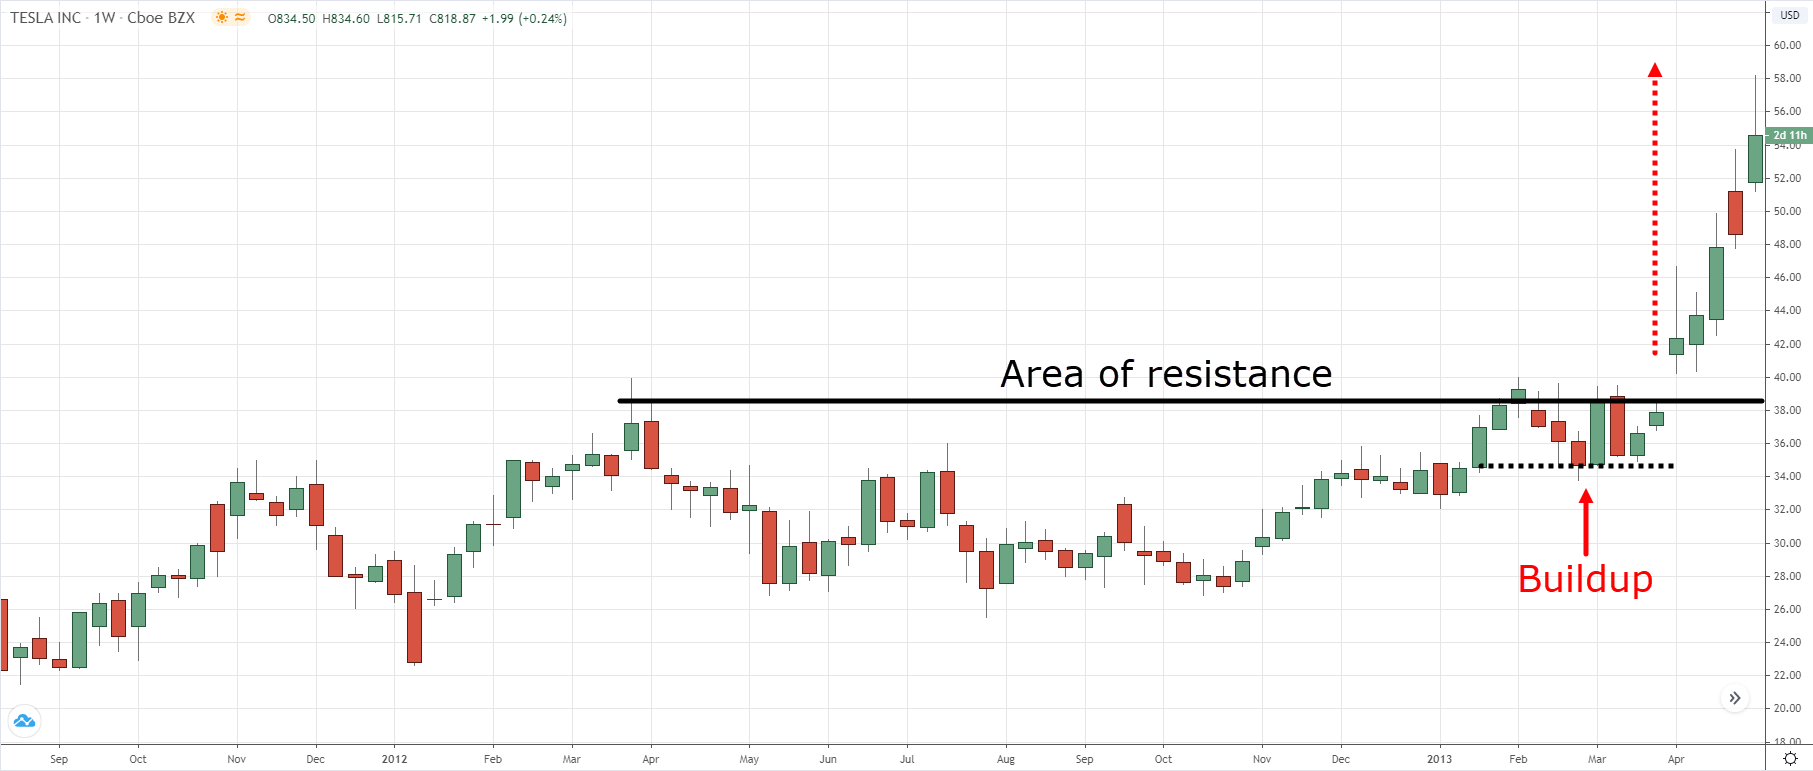
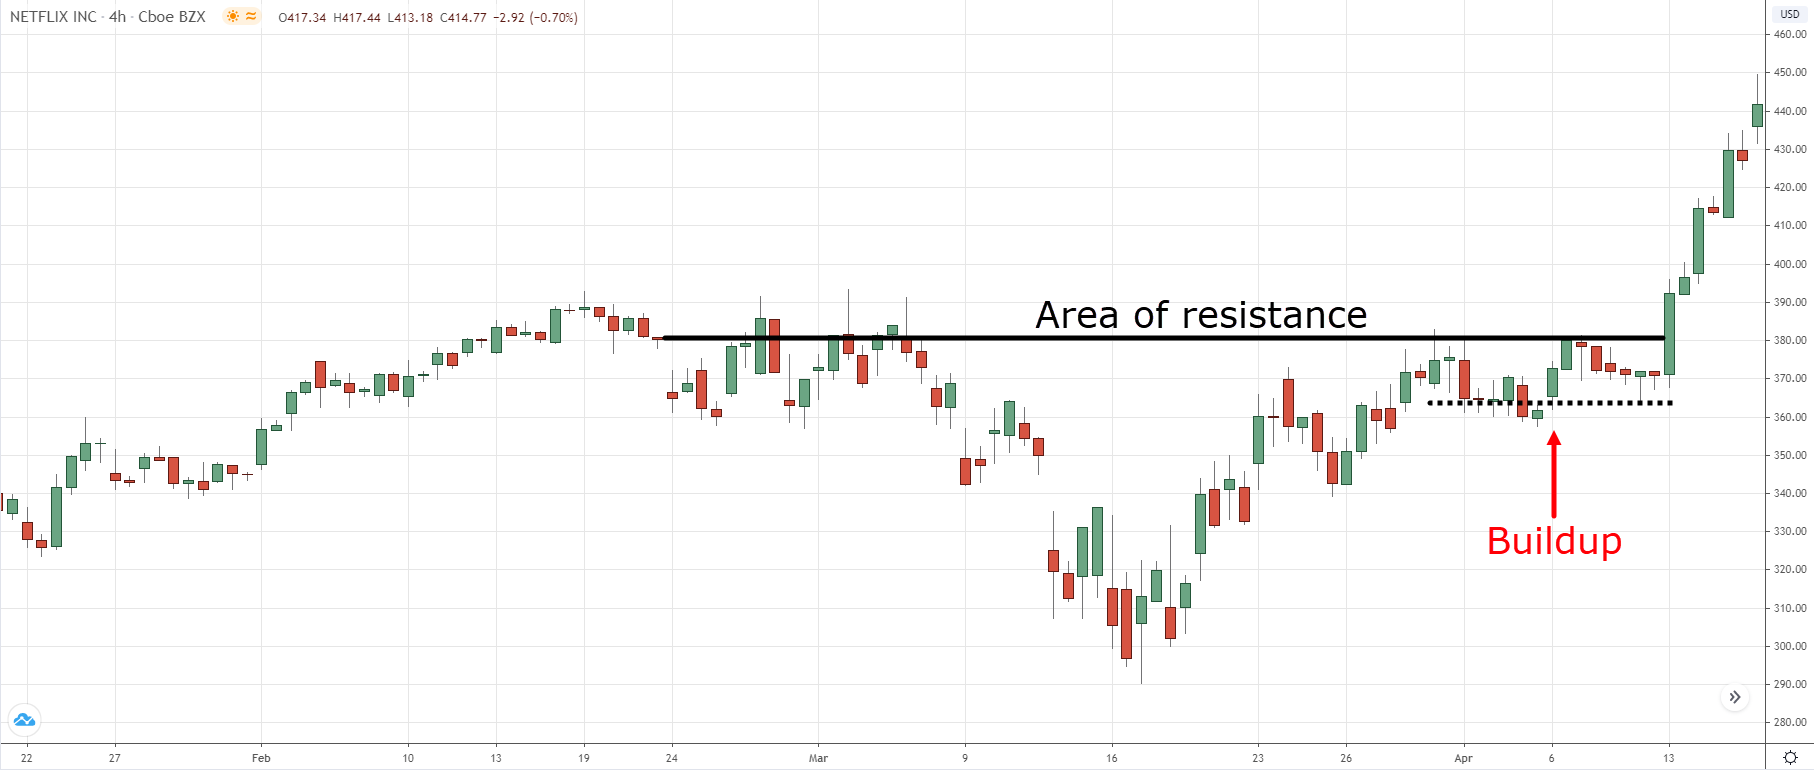
You want to trade breakouts — with buildup.
What’s a buildup?
I’ll explain…
A buildup is a tight consolidation and you’ll notice the range of the candles get smaller.
Here’s what I mean…
Now, a buildup is powerful for 2 reasons…
1. You increase your profit potential and lower your risk
Earlier:
You saw that if you trade breakouts without a buildup, it’s likely to fail.
But that’s not all.
Because where do you put your stop loss?
If you’re like most traders, you’ll put it below Support.
And given the distance of your stop loss, you must reduce your position size (so you can maintain your risk).
This means the market needs to move a lot just for you to earn 1R (which is your risk per trade).
An example…
If you have a stop loss of 1000 ticks, the market needs to move 1000 ticks in your favor so you can earn 1R.
Now…
If you have a tighter stop loss, you can increase your position size (while maintaining your risk).
This means the market needs to only move a little for you to earn 1R.
An example:
If you have a stop loss of 100 ticks, the market needs to move 100 ticks in your favor so you can earn 1R.
Can you see how powerful this?
If you want to learn more, go watch this training video below…
2. You improve your winning rate
Imagine:
The price is at Resistance.
You know this is an area where the price could reverse lower.
But it didn’t.
Instead what you get is a buildup at Resistance.
So, what does it tell you?
Perhaps there’s no selling pressure.
Or, there’s strong buying pressure supporting the higher prices.
Whatever the case is, this is a sign of strength.
Here’s an example:
But don’t forget…
When the price breaks above Resistance, traders who are short will cut their losses.
Plus, momentum traders will hop on board and buy the breakout.
All these factors increase the buying pressure — and the market is likely to breakout higher.
Does it make sense?
Great!
Then let’s move on…
Breakout Trading: When do you buy breakouts?
So…
The buildup is a core concept whenever I trade breakouts.
However, there are variations of it.
For example:
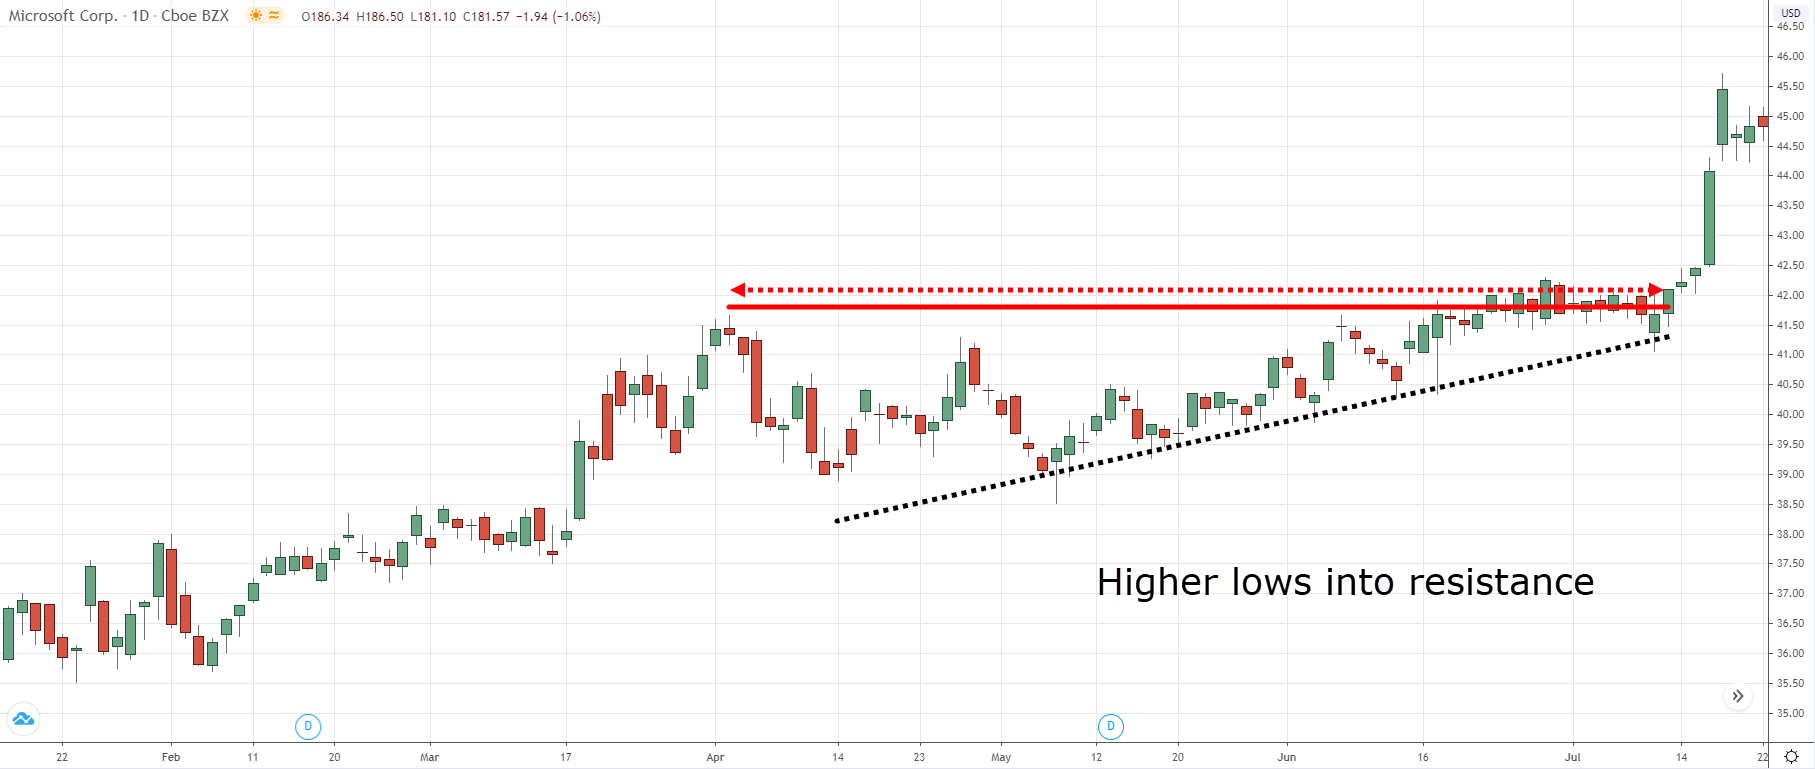
When you see higher lows into Resistance, is this a sign of strength or weakness?
Take some time to think about it…
…
…
…
Now, similar to the buildup concept I shared earlier.
When you see higher lows into Resistance, it tells you:
1. There’s no selling pressure
2. There’s strong buying pressure supporting the higher prices
3. Buy stop orders are clustered above Resistance
Clearly, this is a sign of strength.
Here’s how it looks like:
Now you might be familiar with this chart pattern, and it’s called an Ascending Triangle.
So if you spot such a pattern, it means the market could breakout higher.
If you want to learn how to trade this chart pattern, go check out The Ascending Triangle Trading Strategy Guide.
Next…
Breakout Trading: When do you short breakdowns?
This is the inverse of what you’ve learned earlier.
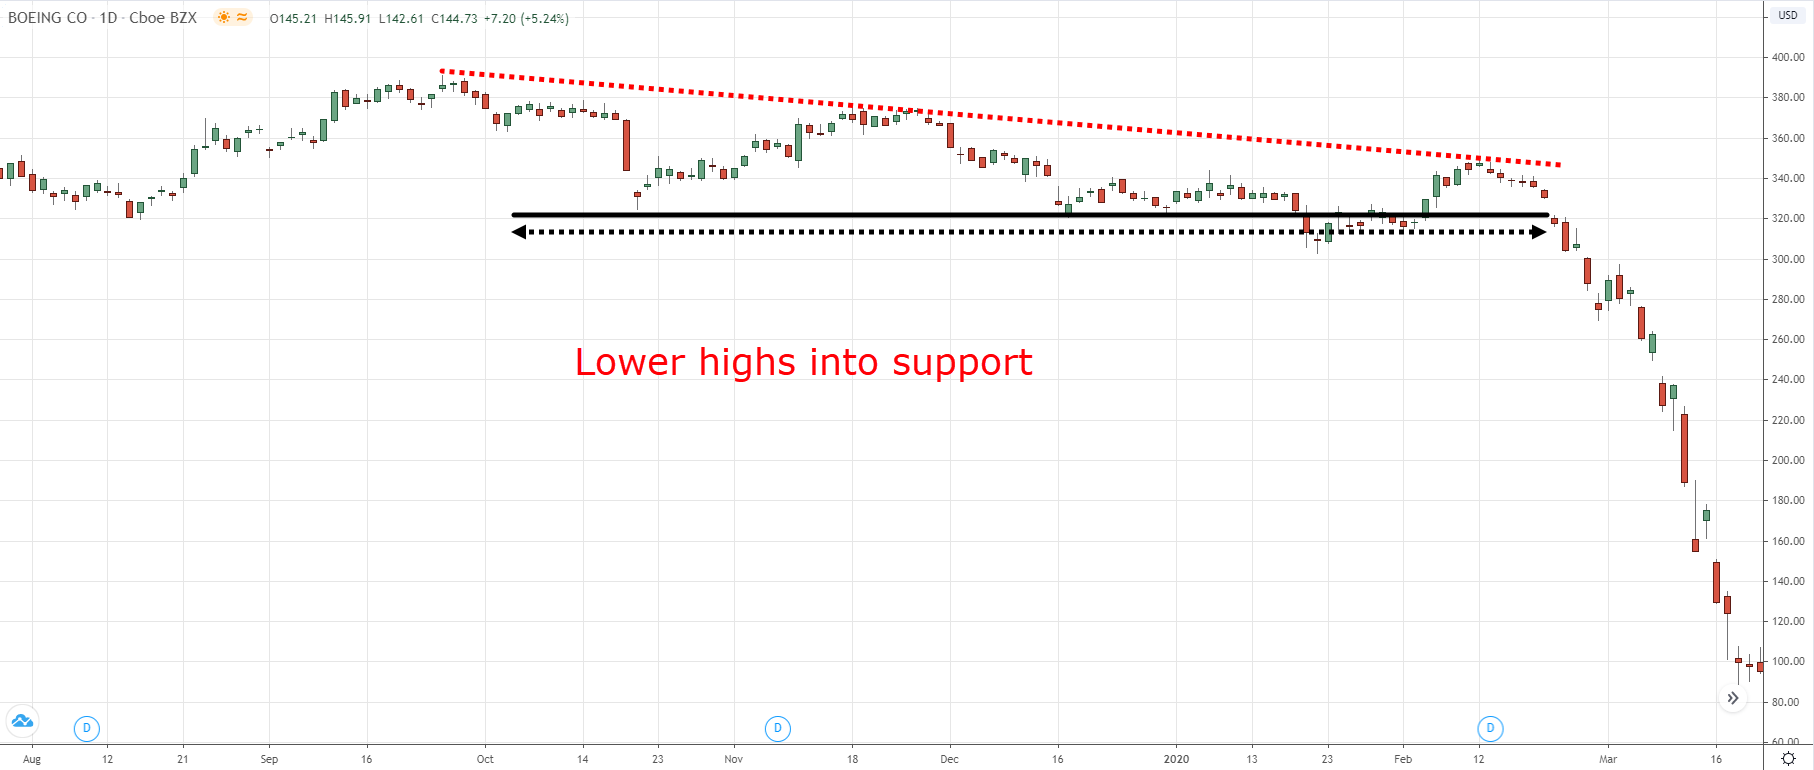
Whenever you see lower highs into Support, it tells you:
1. There’s no buying pressure
2. There’s strong selling pressure pushing the price lower
3. Sell stop orders are clustered below Support
Clearly, this is a sign of weakness.
Here’s how it looks like:
Now you might be familiar with this chart pattern, and it’s called a Descending Triangle.
So if you spot such a pattern, it means the market could breakdown lower.
Now…
You’ve learned when to buy breakouts and short breakdowns.
Moving on, you’ll learn how to identify explosive breakout trades about to occur.
Are you excited?
Then read on…
How to identify explosive breakout trades about to occur
Here’s the thing:
The market is always changing.
It moves from a range to trend (and vice versa).
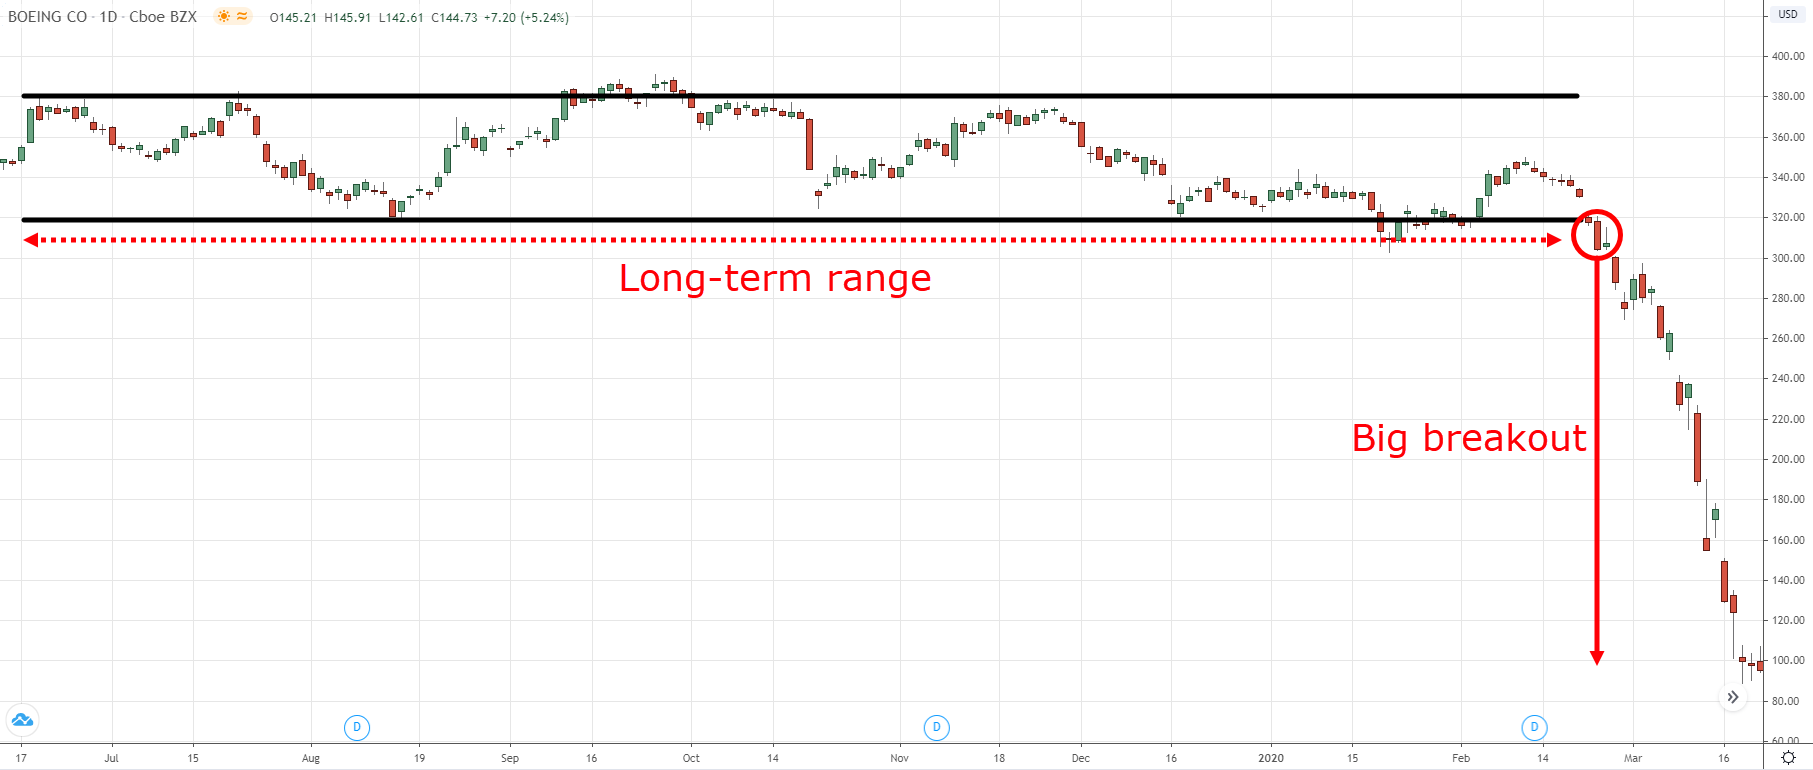
And the longer a market stays in a range, the harder it breaks.
Here’s an example:
But why?
Because the longer the market is in a range, more orders are placed in the market.
Let me explain…
Bullish traders will put buy stop orders above Resistance (hoping to catch breakouts).
Bearish traders would short the market and have their stop loss (also a buy stop order) above Resistance.
As time passes…
You’ll get an overwhelming amount of buy stop orders above Resistance.
So, when the market breaks out, it’ll trigger these clusters of buy stop orders which fuel strong buying pressure.
So…
If you want to identify explosive breakout trades above to occur, pay close attention when the market is in a range for a long time.
Because the longer it range, the harder it breaks.
Breakout Trading Strategy: The Trend Trading Breakout
Here’s the deal:
In a strong trend, the price tends to stay above the 20-period Moving Average.
So if you’re waiting for a pullback, then you’ll be disappointed as the market continues making new highs — without you.
Here’s what I mean:
Now…
There’s a time for trading pullbacks, but not when the market is in a strong trend.
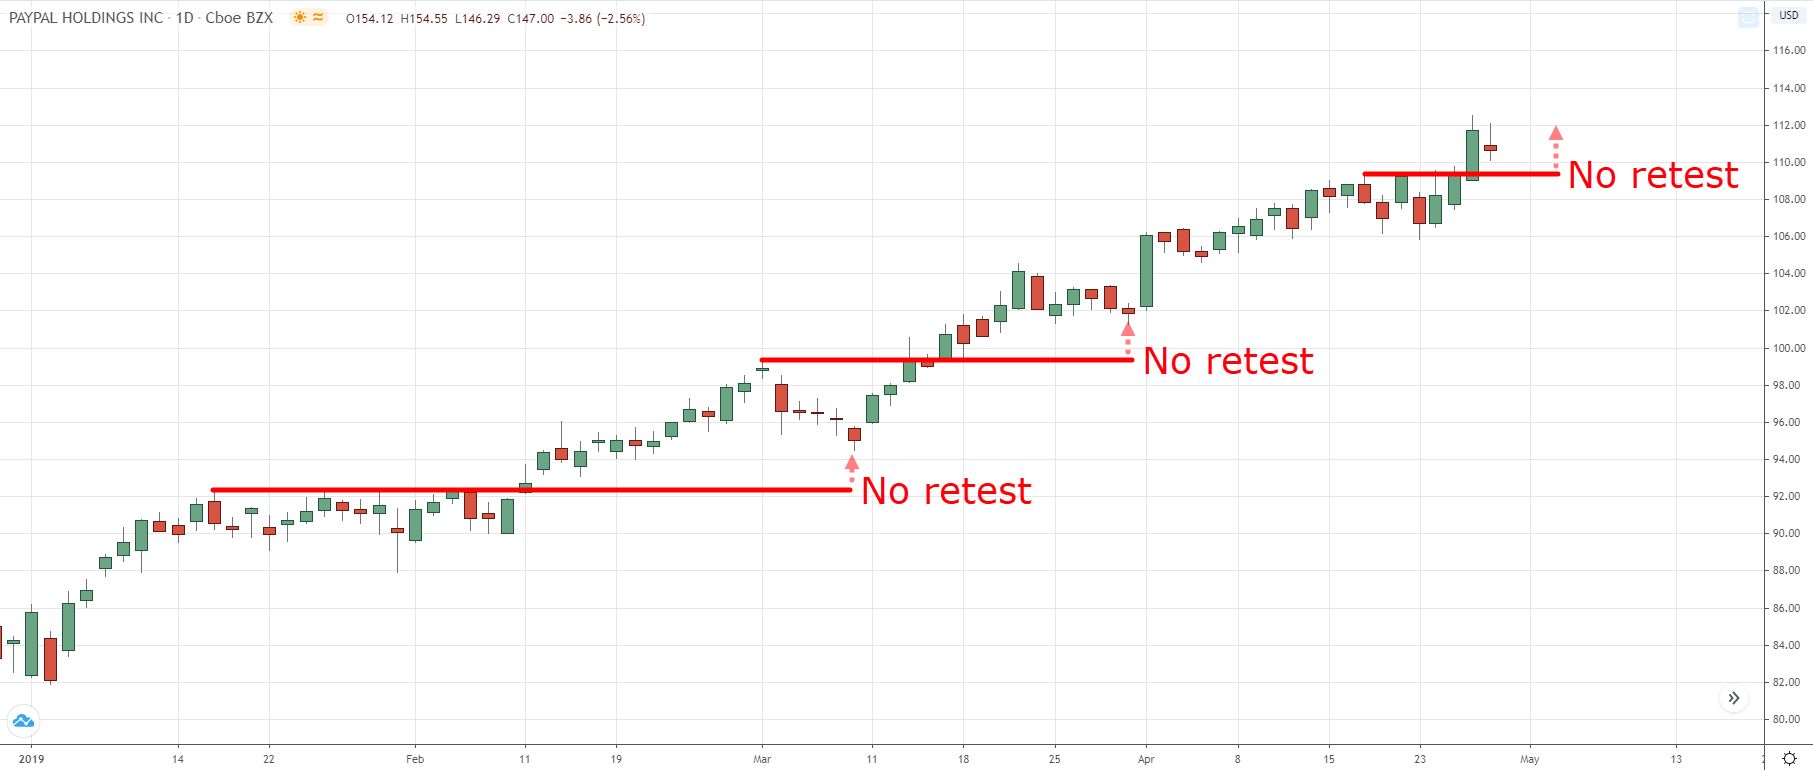
Instead, you want to trade breakouts.
That’s why I call this breakout trading strategy… The Trend Trading Breakout.
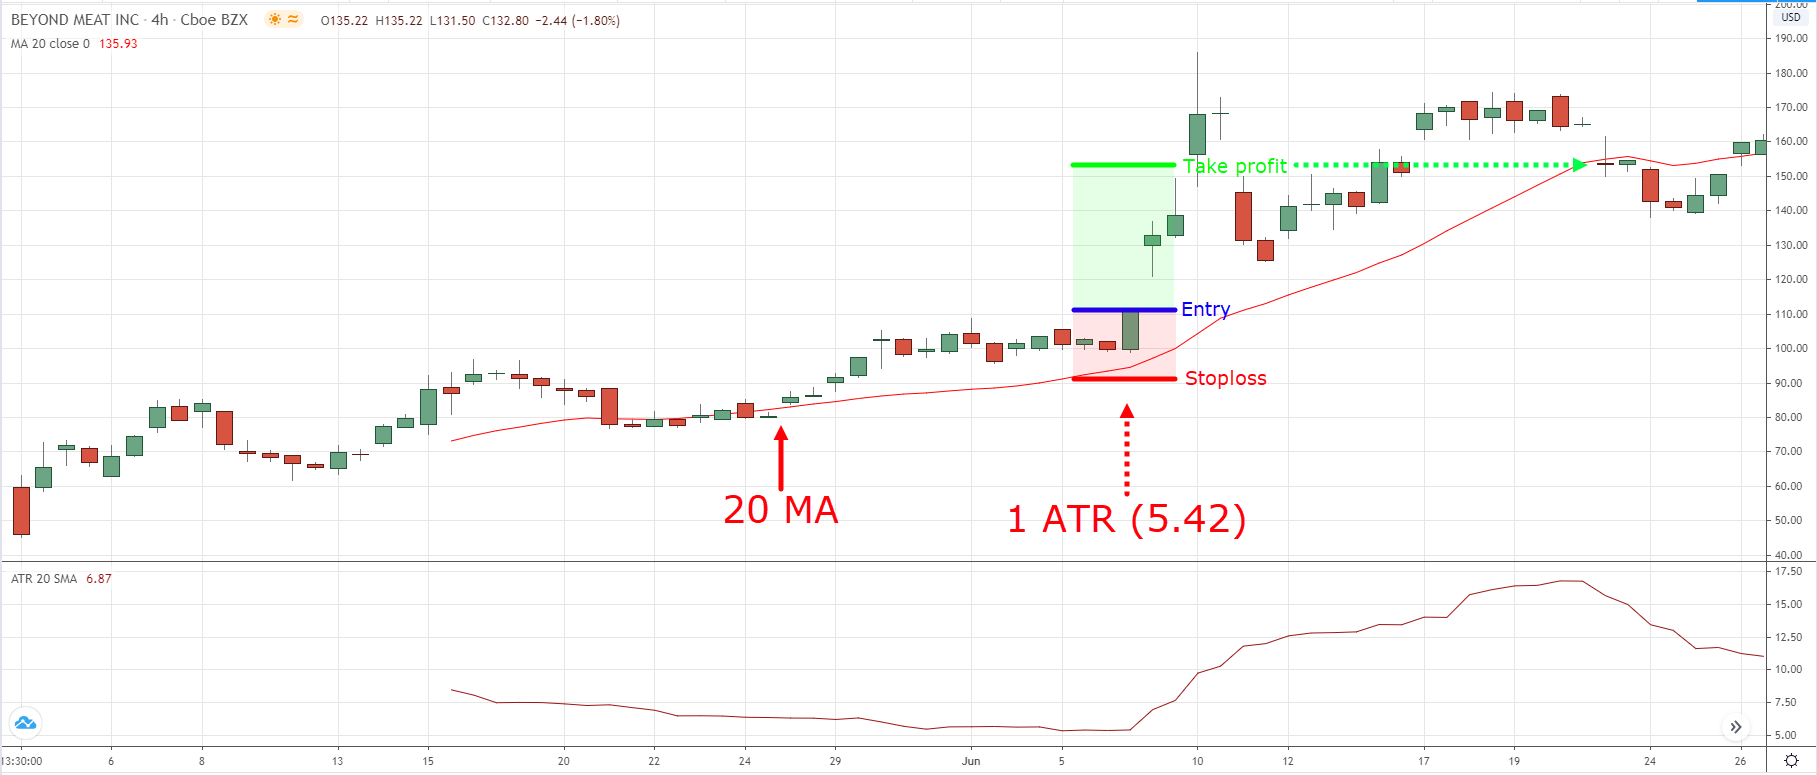
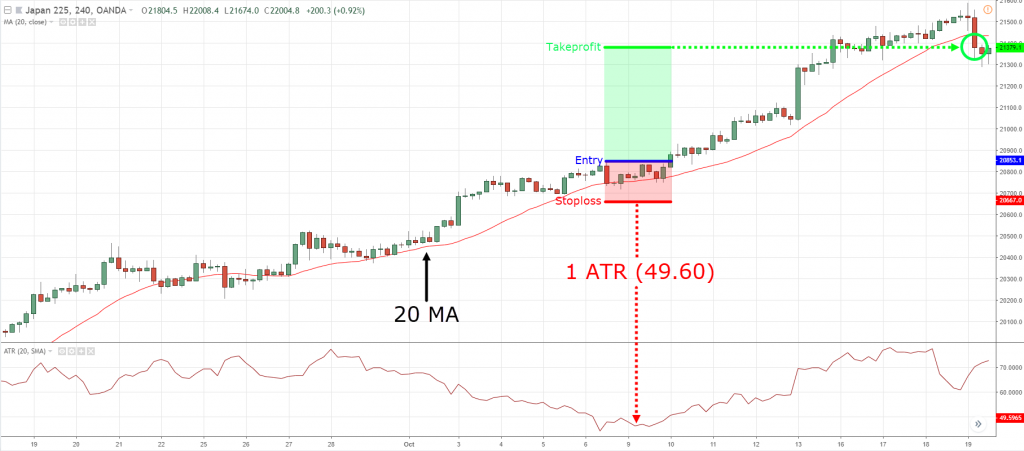
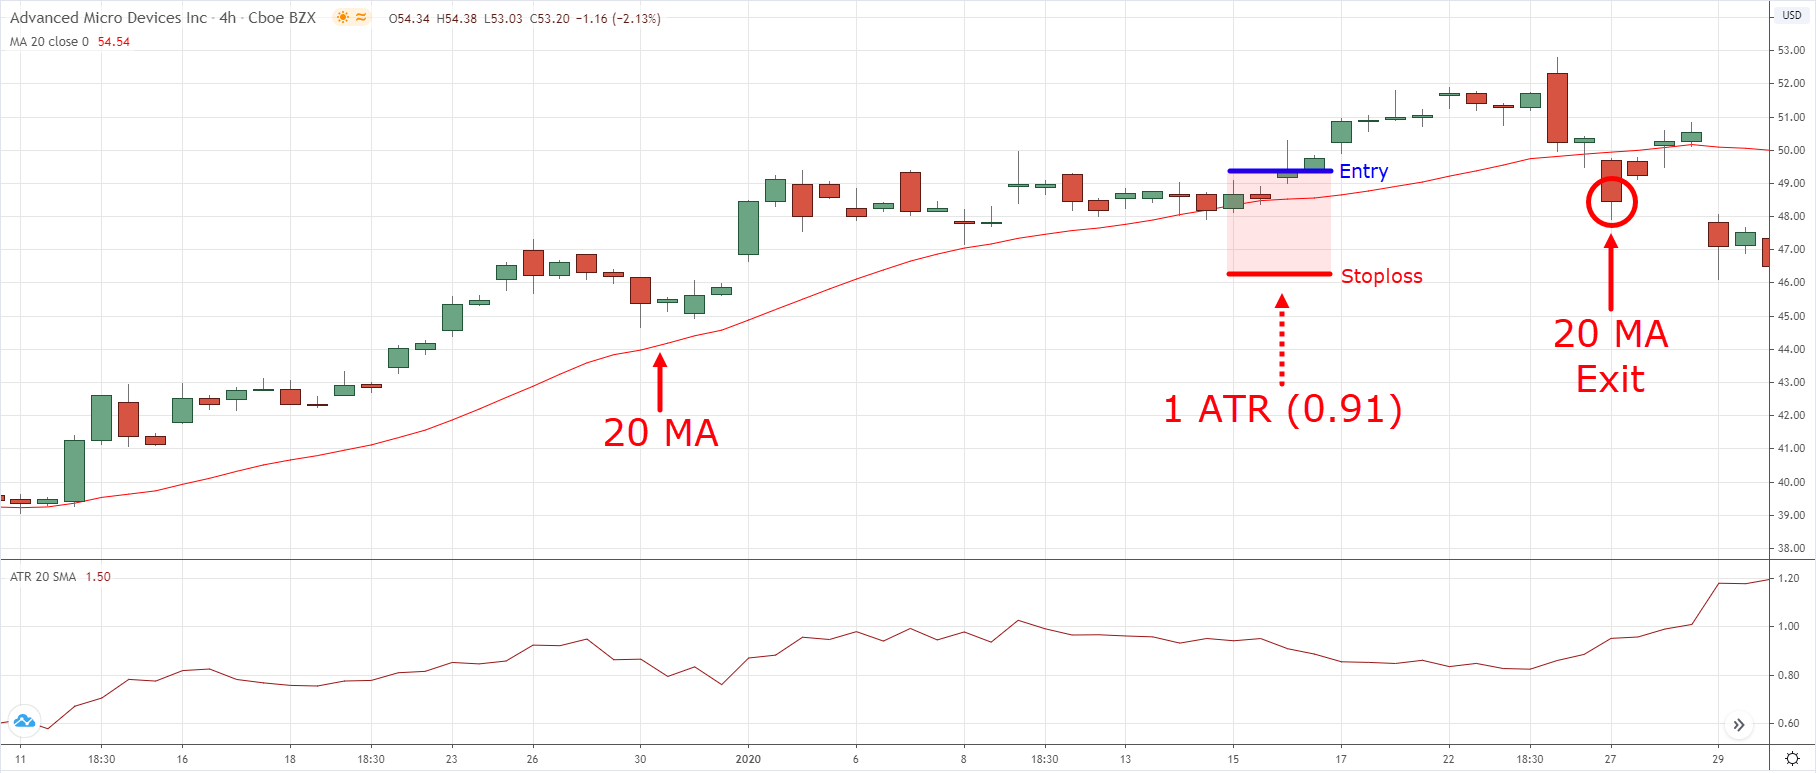
Here’s how it works:
1. The market is in a strong uptrend (respecting the 20MA)
2. Buy breakouts above the swing high
3. Set your stop loss 1 ATR below the swing low
4. Exit the trade if the price closes below 20MA
An example…
Winning trade on (Beyond Meat):
Winning trade on (NI255):
Losing trade on (AMD):
So here’s the takeaway…
In a strong trend, you want to buy breakouts (or short breakdowns) because the market is unlikely to offer a pullback.
Conclusion
So here’s what you’ve learned today:
- Don’t buy breakouts after a strong bullish momentum because that’s when the market is about to reverse
- You want to buy breakouts with a buildup
- Higher lows into Resistance is a sign of strength
- Lower highs into Support is a sign of weakness
- The longer the market is in a range, the stronger the breakout
- A Trend Trading Breakout strategy that works
Now here’s a question for you…
How do you trade breakouts?
Leave a comment below and share your thoughts with me.

Discipline and Patience is what most of us lack. Your teaching as always is excellent 👌
It’s not easy, but as long as you’re persistent, you’ll be able to earn them effortlessly. Thanks Natasha!
You nail it. Discipline and patience.
Takes time to master the most!
It’s one of the strategy that i used. Thank you for this, Rayner!
Awesome to hear that Future Investor!
Sir you are teaching very well for free i am very grateful to you app is god for me sir i am I have to do a lot of work for the poor by getting out of my debts sir I need your blessings thank you again sir you will be very grateful.
You’re welcome Sandip, glad to hear that!
Nice, I enjoy reading it
Awesome to hear that!
Great educational content. I’ve been caught severally by the market trading breakouts wrongly and blindly. Reading this rich content today has taught me how to trade breakouts and breakdowns the right way. It’s really an eye-opener and a great know-how guide.
Thank you Theo for the guide.
Great to hear that Foluso, just remember to be consistent now!
I learn a lot from this material
May God bless you
I’m glad to hear that Fredrick!
Thank you Rayner. This is powerful stuff. Can’t wait to cash in on the investment in knowledge. Thank you once more
You’re welcome Rodney, make sure to apply fast!
Hello Mr Rayner. Thanks alot for your sacrificial heart to help the financial market community grow and I am no exceptio.
Please, can you help with the detail mathematical calculation of how to determine the appropriate stop lose value from the entry position using the ATR indicator?
Quick response will be much appreciated, Even in my email.
Thanks.
Hey there Oyebade, this article may help: https://www.tradingwithrayner.com/atr-indicator/
And yes, it will also apply to stocks as well!
Your content is so simple to understand.
Thanks alot.
You’re welcome, Pushpendra!
I trade break out with market structure in resistance or support, thank you very much my master for teaching me all this, my name is MARV TECH FX one of your loyal student I love you so much my mentor
Great to hear that Marvis, you’re welcome!
I used to wait for any breakout and just place an order ,so dont you send signals
Thank you for sharing, Perseverance!
Discipline and patience is the key in trading
Definitely, well said Eduardo!
I usually trade the breakout and re-test strategy but it’s pretty rare to find proper set ups in the higher timeframes. They will show up all the time in 5min charts but with lots of traps. False breakouts all over the place constantly! I know we can’t avoid losses in trading but it’d be cool to identify false breakouts to avoid losing money at the end.
Great, thanks for sharing your experience, Kina!!
Your piece is always a good read. You are teaching alot for free and just be informed that your efforts are appreciated.
Thank you for the kind words, Sulaiman!
a long term in a stock build area when the candles is smaller and there selling pressure is too low
Can this strategy be used for futures (forex)
Definitely, blessed!
You’re a blessing to this generation through your elaborate teaching thanks a lot 🙏
I have questions sir
Please sir…. can I trade breakouts strategy in different timeframe or which timeframe is suitable for breakouts strategy?
Hey there Adekunle, breakouts happen in every timeframe
So, choose a timeframe that fits you and lifestyle, focus on that!
Thanks so much
You’re welcome, Adekunle!