
This post is written by Jet Toyco, a trader and trading coach.
Are you confused by the number of indicators out there?
Perhaps you already have a ton of indicators on your chart but you’re not seeing significant results?
Don’t worry.
Because in this post, you’ll discover the three best indicators for swing trading, how to use them properly to profit from the markets, and which ones to choose.
Sounds good?
But first…
What is Swing Trading and How Does it Work
Before we identify the best swing trading indicators, we must first know what we are using them for.
So, swing trading is a type of trading methodology that aims to buy low and sell high:
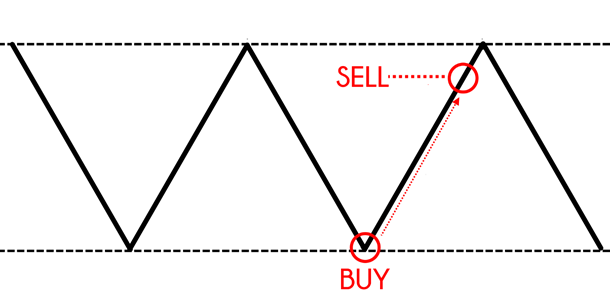
It means that we are looking for indicators that meet the goal of buying low and selling high and finding one that aims to achieve this as simply and as efficiently as possible.
Let’s get started…
Criteria For Choosing The “Best” Indicators For Swing Trading
Before we get to the meat of this article…
It’s essential to know what we mean by the best indicators for swing trading.
Criteria #1: Simple and easy to understand
There’s no point in using it if you can’t make heads or tails on how the indicator works.
How come?
Because indicators are not magic lines on your chart, but tools you use to fulfill what you want to achieve on a chart.
It means that your results are more tied to your understanding of the indicator than the indicator itself.
Makes sense?
Criteria #2: Can serve multiple purposes
Here’s the thing:
Having more indicators on your chart does not increase your chances of a winning trade but only gives you analysis paralysis and not taking the trade.
You’d probably get better results if you only had a handful of indicators on your chart!
That’s why we want to have an indicator that can single-handedly:
- Determine your entries
- Determine how you’ll take profits
- Determine your stop loss
Having fewer indicators keeps your charts clean and helps you make faster decisions which will make your trading process much more efficient.
Excellent, am I right?
Criteria #3: It is free and accessible
I’m sure your eyes are probably sparkling right now, knowing that you don’t get to spend a dime for these indicators, but it’s true!
These best indicators for swing trading could be found on TradingView, and all you need to do is to go to the website and click “Chart.”
Sounds good?
Then let’s get started…
Swing Trading Indicator #1: Donchian Channel
Now, I know the name sounds super scary, but let me explain…
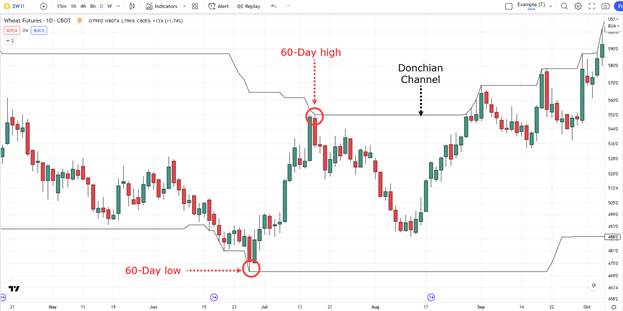
The Donchian Channel is one of the best technical indicators for swing trading where it visualizes the highs and lows on your chart depending on the period you want to look at.
So, let’s say you want to determine the highest high and the lowest low over the past 60 days.
It would look something like this…
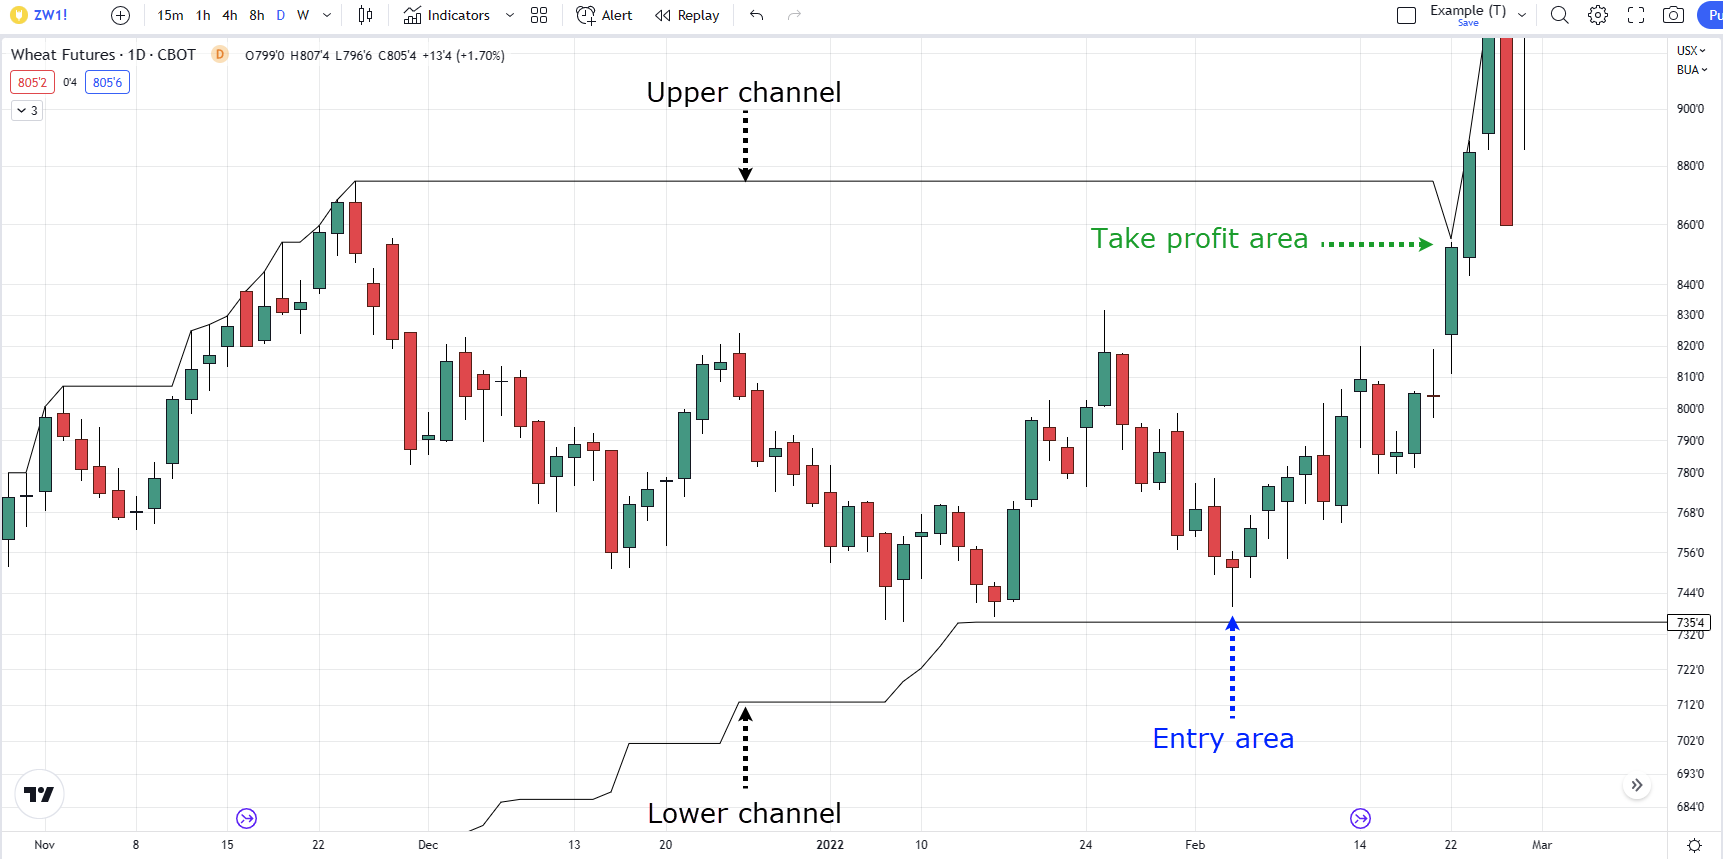
Wheat Futures Daily Timeframe:

That’s pretty much it!
Now I want you to look at the chart.
What do you see?
If you look closer…
This indicator already tells you where exactly you can potentially buy and sell!
It means that you can use the lower channel as a reference to buy, then use the upper channel to reference when to sell!
Wheat Futures Daily Timeframe:
Pretty powerful stuff, am I right?
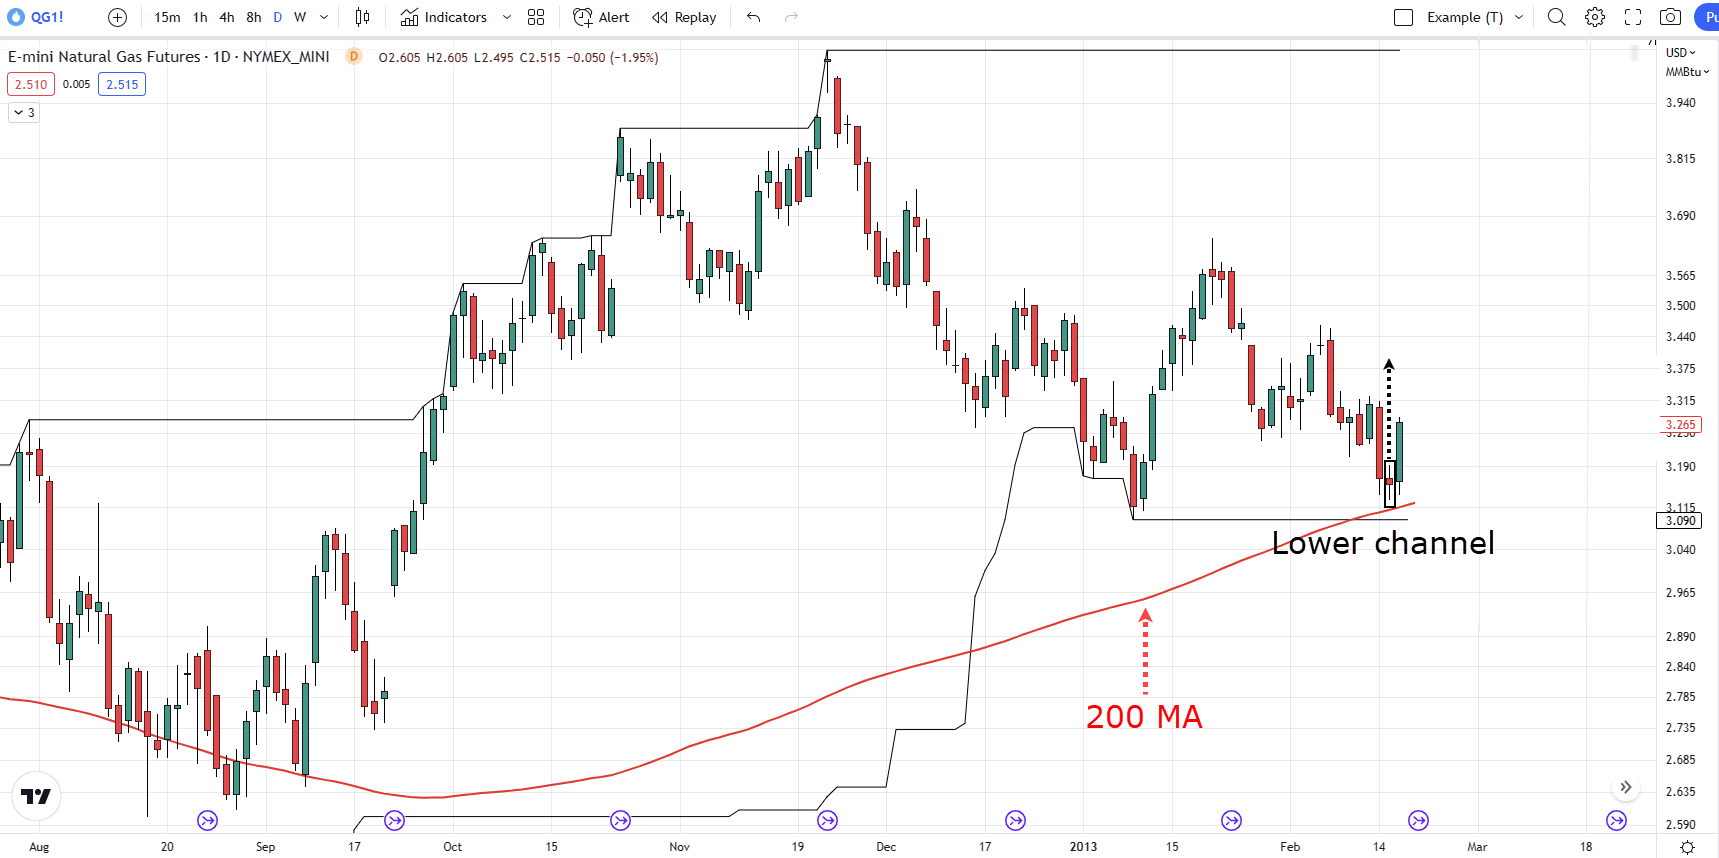
But of course, you’d still want to use trending indicators such as the 200 MA to make sure you are trading on the right side of the trend.
So if the price is above the 200 MA, then you’d want to be buying along the lower channel.
E-mini Natural Gas Futures Daily Timeframe:
Likewise…
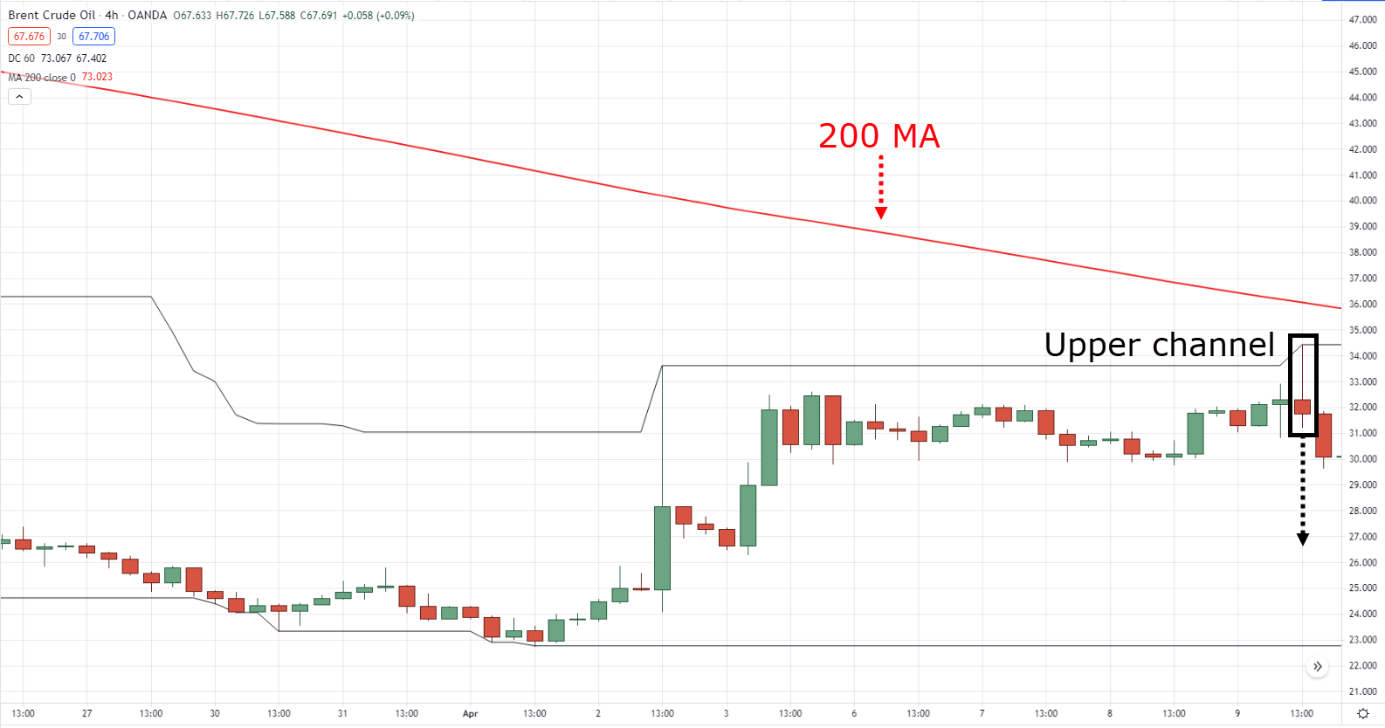
If the price is below the 200 MA, then you’d want to be selling along the upper channel.
Brent Crude Oil 4-Hour Timeframe:
But that’s not all…
Because the next indicator that I’m about to show you will blow your mind that you can even apply it when swing trading the lower timeframes.
Which makes it one of the best trading indicators for swing trading out there.
Keep reading.
Swing Trading Indicator #2: OHLC
The OHLC stands for Open, High, Low, Close.
But of course, that’s just the name of the indicator.
So, what does it do?
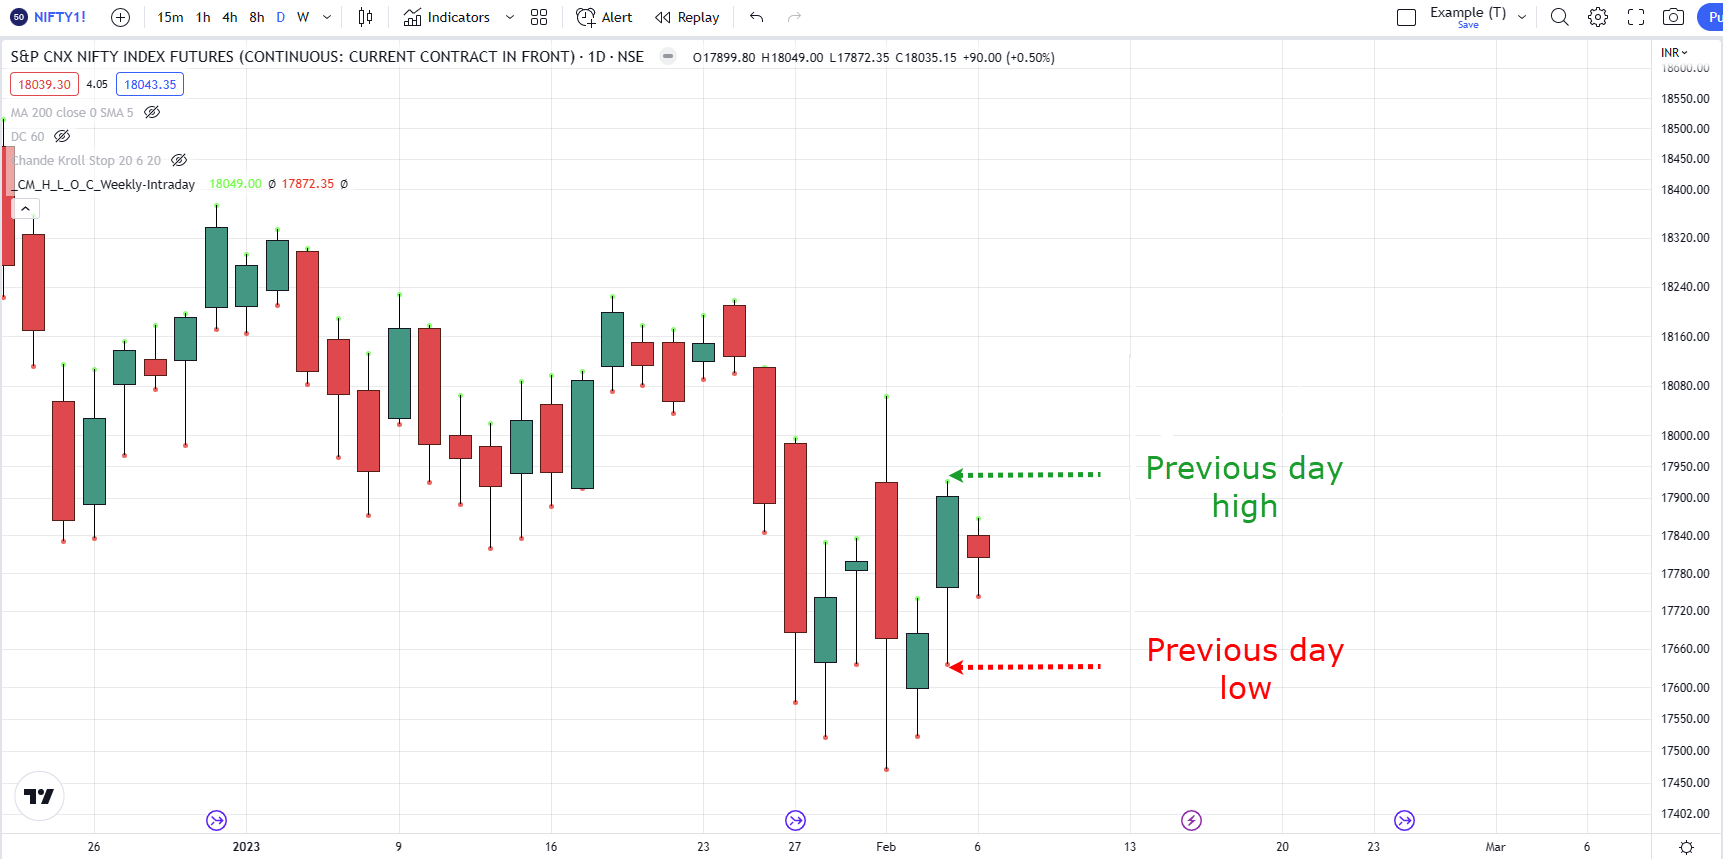
What it does is that it visualizes the highs and lows of the daily candle no matter what timeframe you choose.
Here’s what I mean…
S&P CNX NIFTY INDEX FUTURES Daily Timeframe:
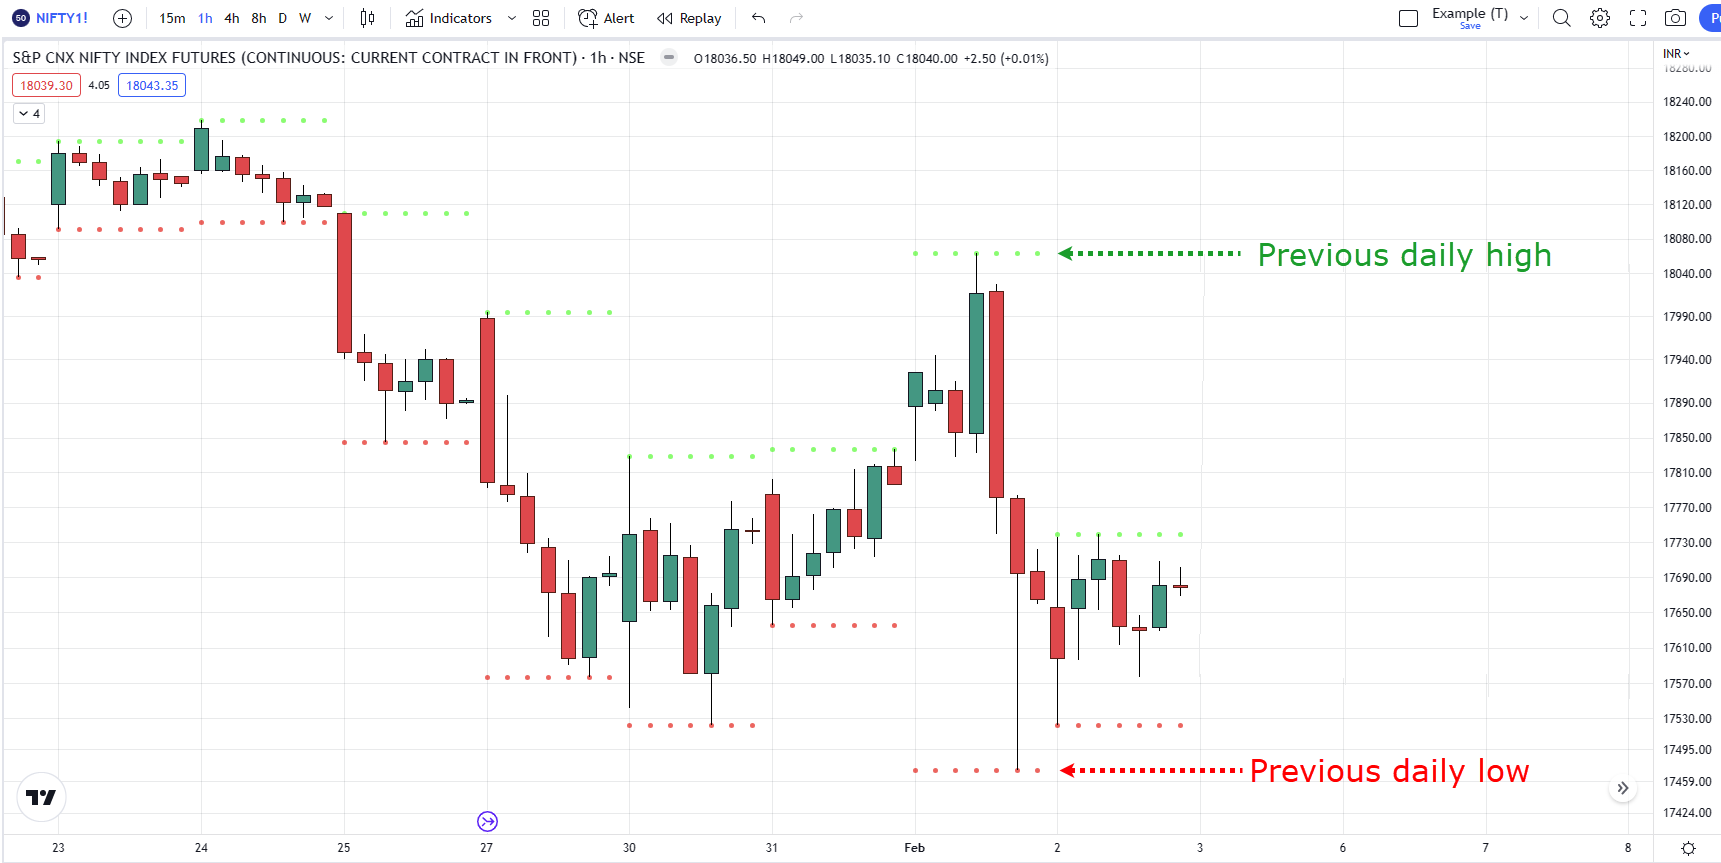
S&P VNK NIFTY INDEX FUTURES 1-Hour Timeframe:
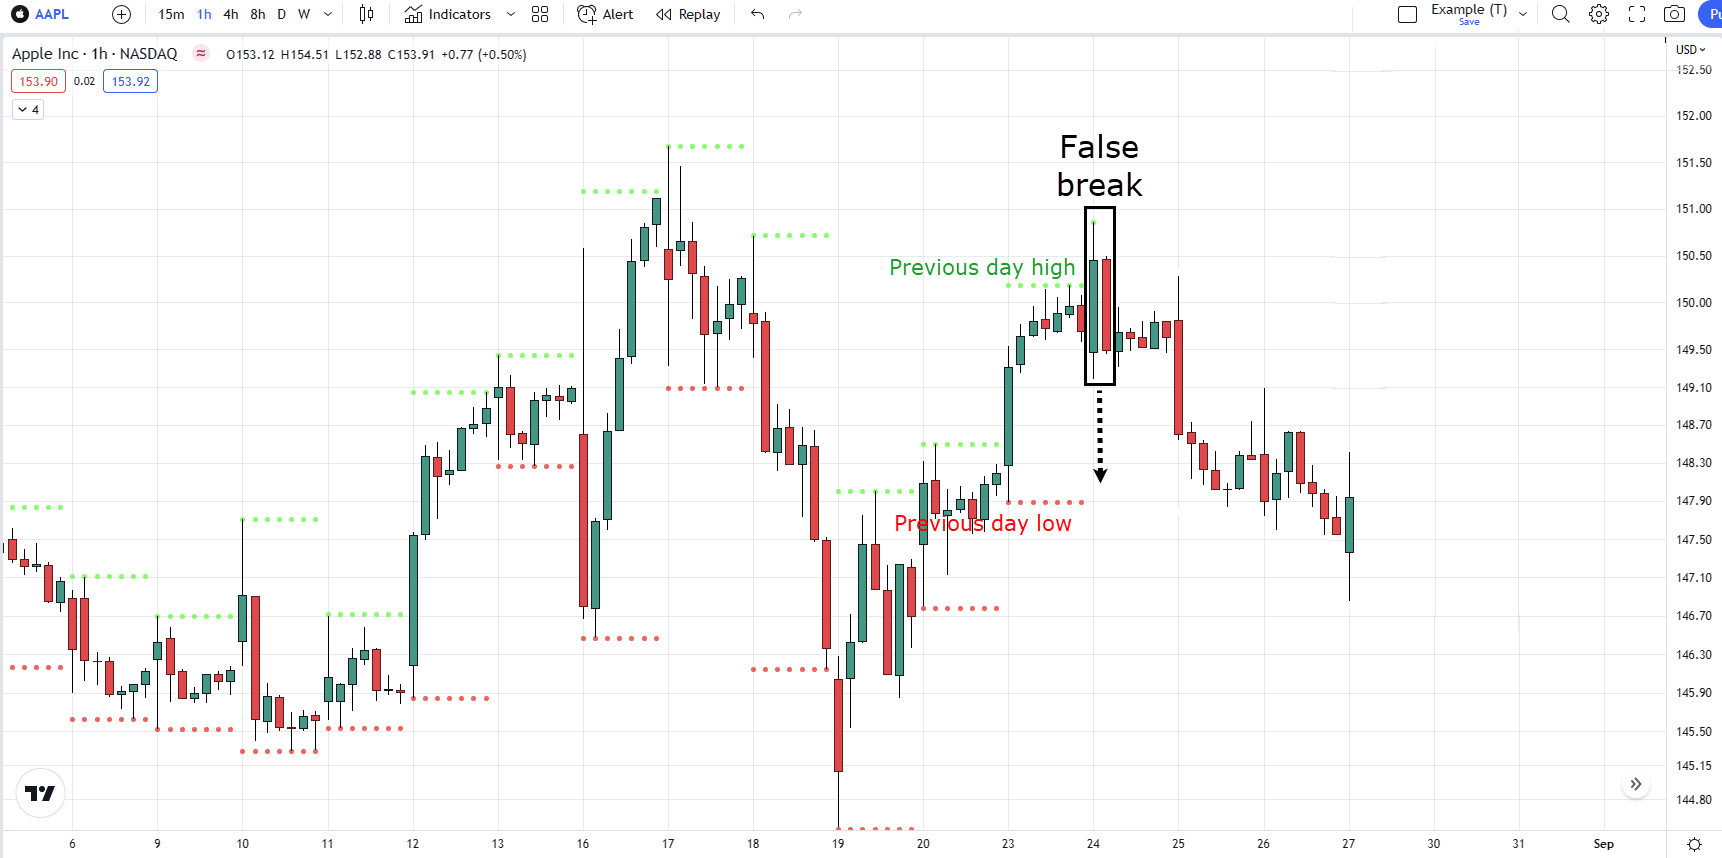
So, how can you use this indicator in your trading?
You can go short when the price forms a bearish candle from the previous day’s highs and look to take profit before it reaches the previous day’s low.
Apple Inc 1-Hour Timeframe:
You’re probably wondering:
“Why should I use the daily highs and lows?
“What’s so important about it?”
It’s because some markets statistically tend to reverse from their daily highs and lows, while some markets tend to continue trending beyond their daily highs and lows.
If you want to learn more, you can check it out here, which can help you apply the best trading indicators mentioned in this article
Now, if you are a price action trader, you will love the next indicator on the list.
Check this out…
Swing Trading Indicator #3: Zig Zag
As a price action trader, you know how important it is to determine the market structure.
Microsoft Corp Daily Timeframe:
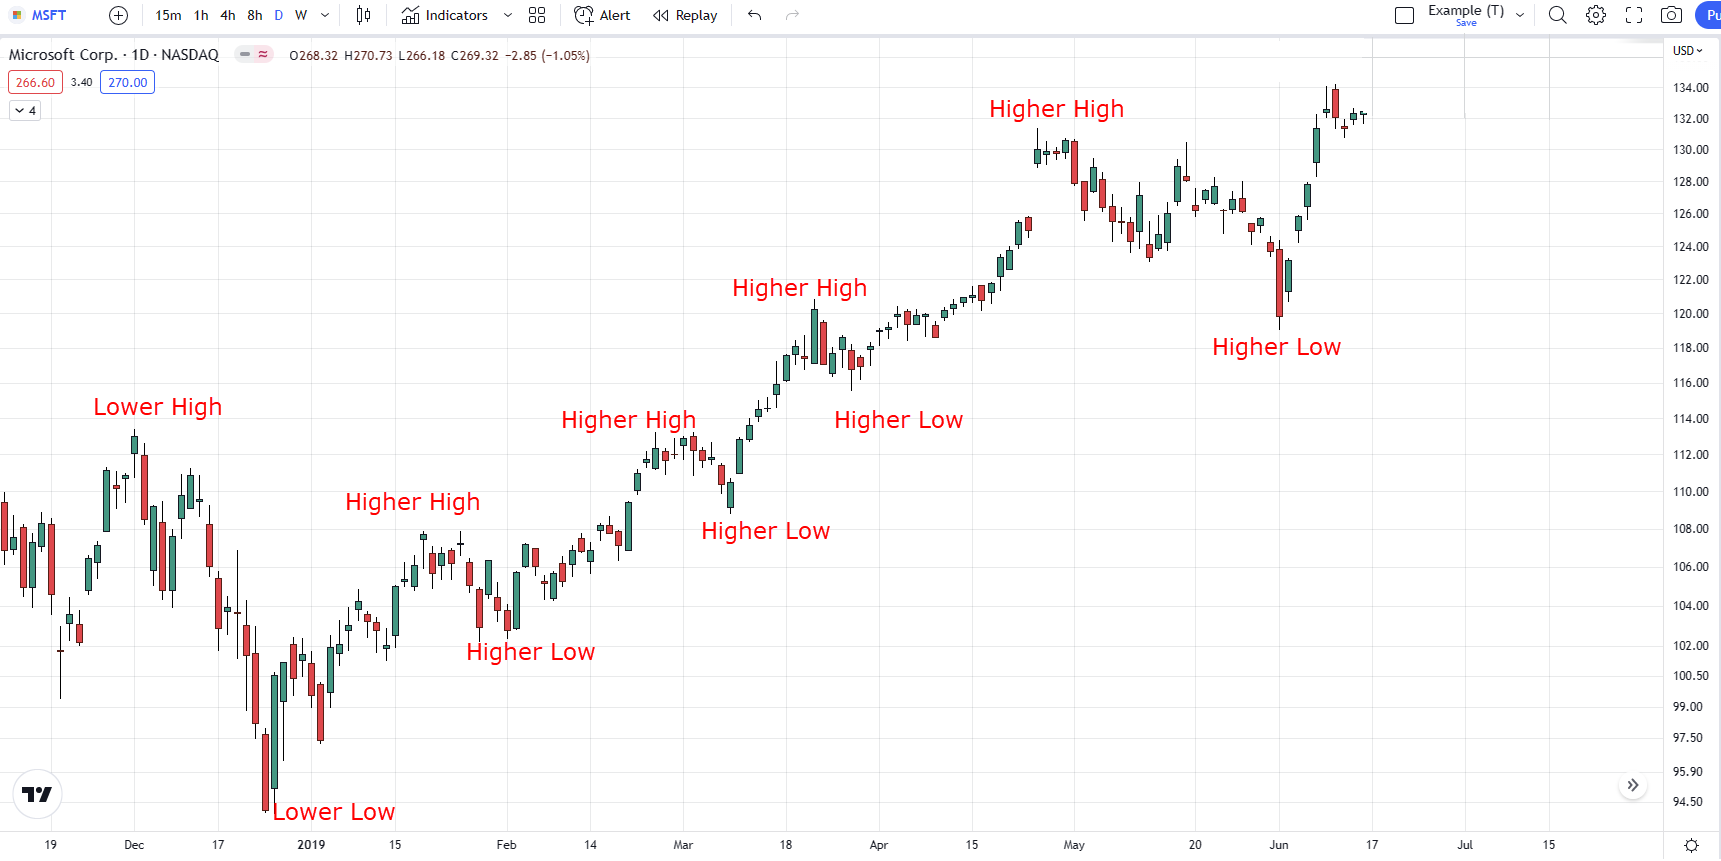
But what if I told you that this indicator could instantly plot it out for you?
Microsoft Corp Daily Timeframe:
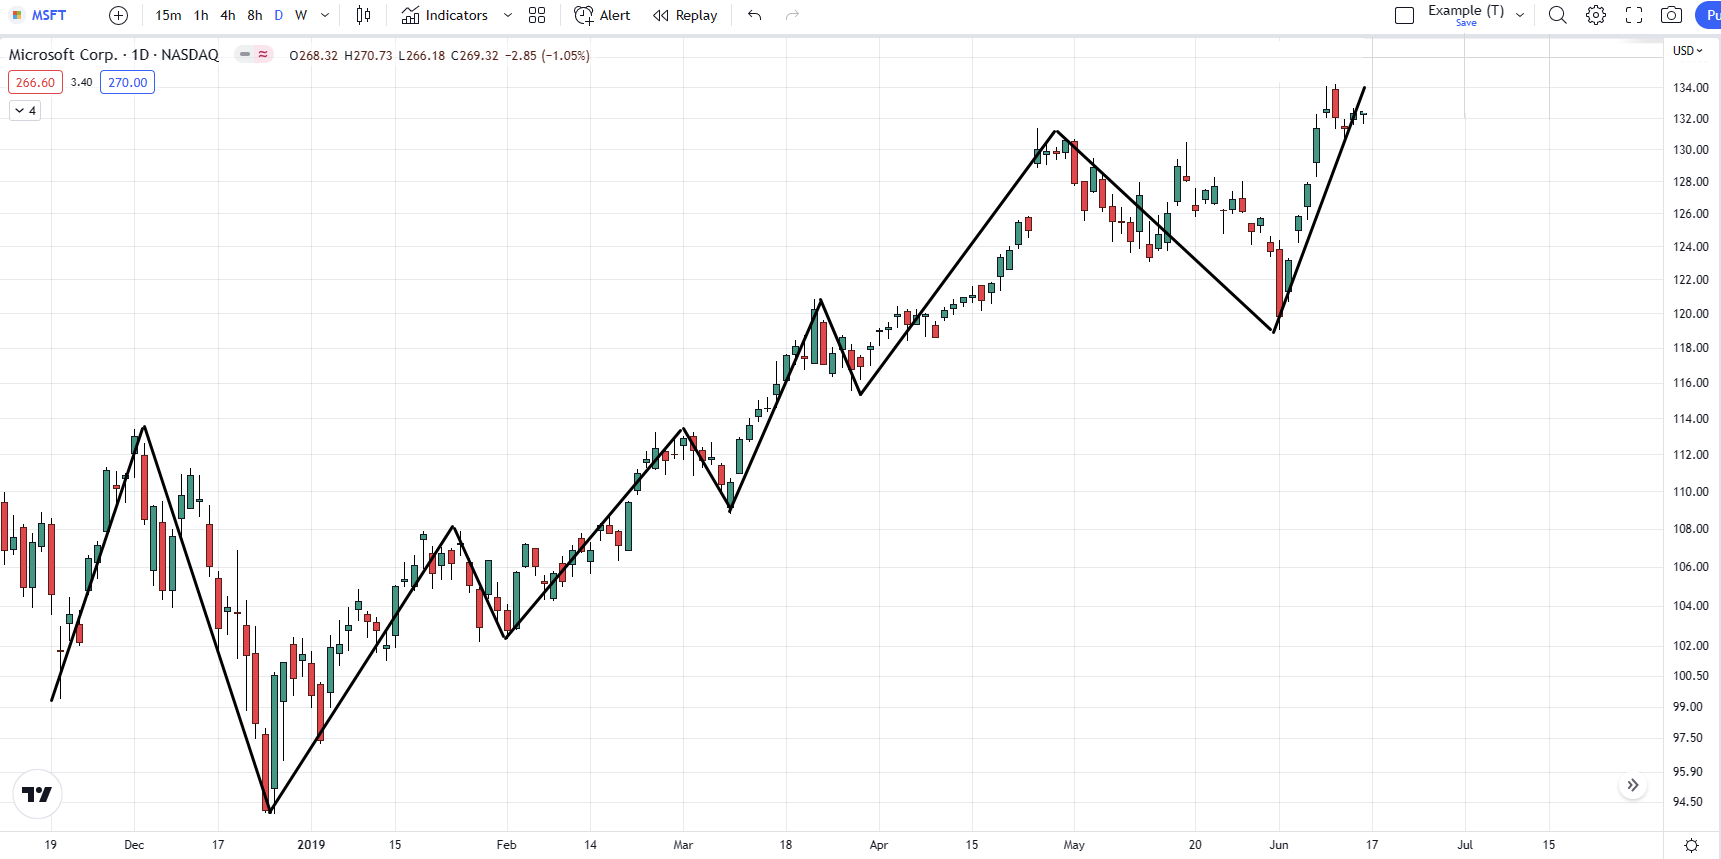
Pretty cool, right?
This indicator puts subjectivity out of the window.
The best part?
You’ll save a lot of time and you’ll make objective decisions on where you could potentially enter and exit your trades!
Doesn’t that sound like one of the best swing trading indicators out there?
But here’s what I mean…
US T-Note Daily Timeframe:
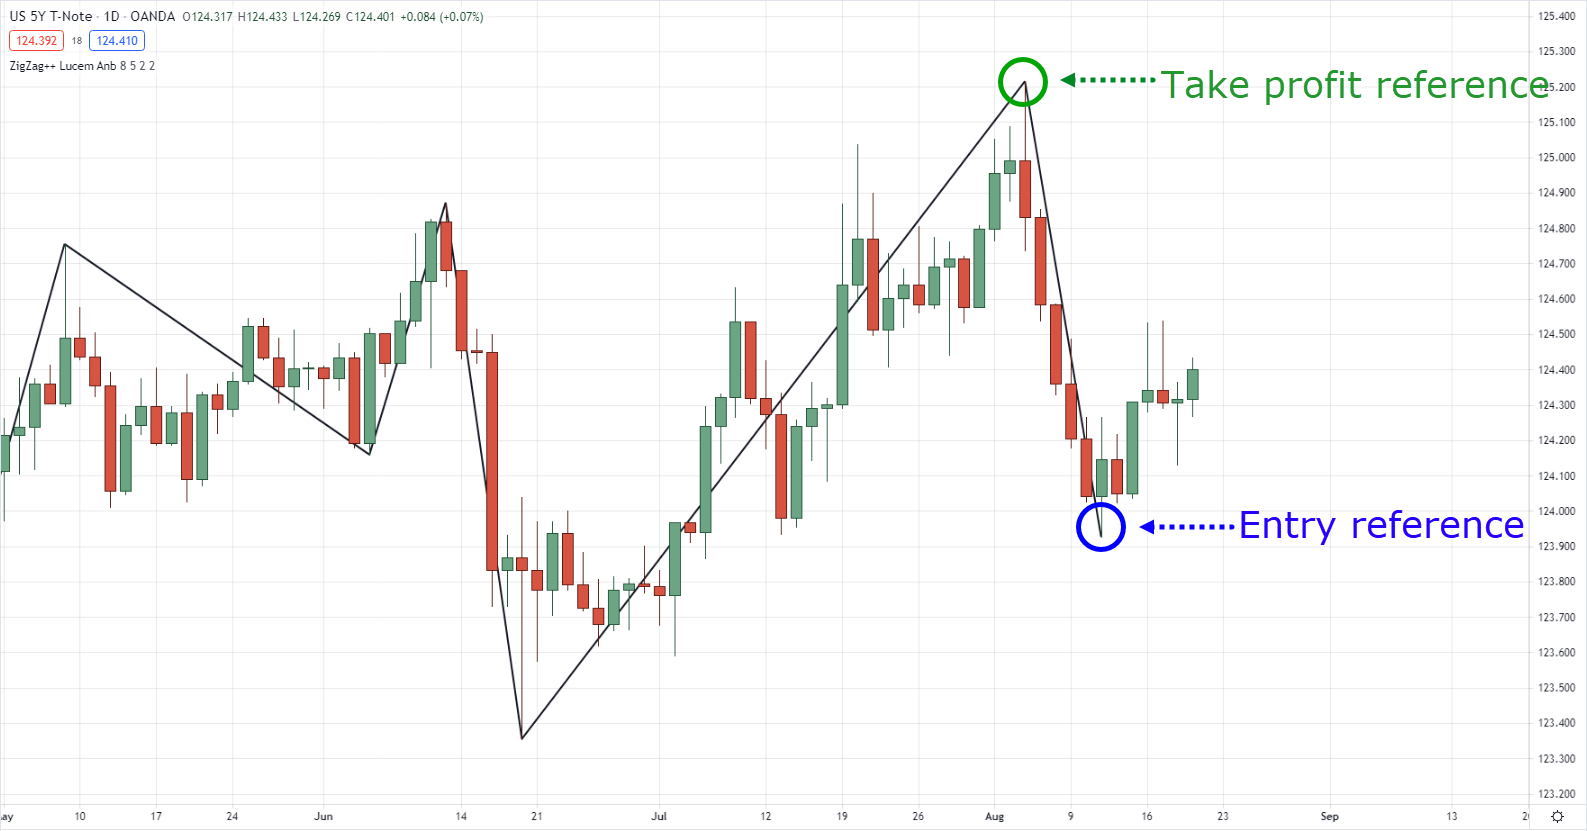
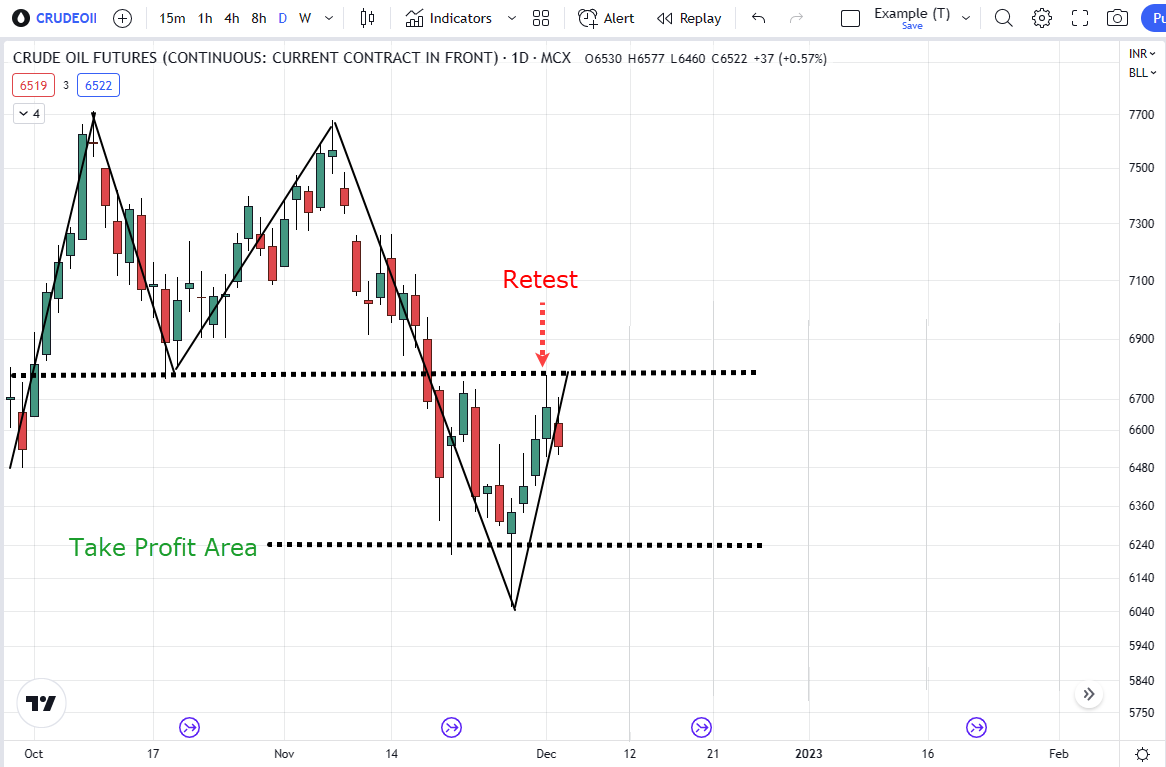
But then again, this indicator isn’t foolproof; you must pair this with price action.
Here’s an example when combining this indicator along with price action…
Crude Oil Futures Daily Timeframe:
By the way, if you wish to learn more about how to apply price action in your trading, check this out: The Price Action Trading Strategy Guide
Cool?
So at this point, you’re probably wondering:
What Is The Best Indicator for Swing Trading?
The bottom line is that it depends on which type of swing trading indicators resonates with you the most; the best one for you.
(It’s not the answer you’re expecting, I know)
However, if you look back…
You’ll notice that all three of these indicators accomplish the same thing: buy low and sell high.
The only difference is the variation of how it’s achieved.
It means that there’s no right or wrong as to which one to choose!
So instead of trying to choose the best one, you should ask yourself these questions:
“Can I use this indicator consistently in the next 50-100 trades?”
“Does this indicator applies to what I have right now in trading?”
“Does the indicator make sense to me?”
With that said…
Let’s do a recap of what you’ve learned today with regard to swing trading indicators.
Conclusion
- The Donchian Channel is the most straightforward indicator that helps you identify where to buy low and sell high potentially.
- The OHLC indicator helps determine entry and exit opportunities when trading the lower timeframes.
- The Zig Zag indicator helps determine swing highs and lows and is best accompanied by price action when looking for trading opportunities.
Now over to you…
What do you think is the best indicator for swing trading?
Is there anything you’d like to add to the list?
Let me know in the comment section below…
https://myteana.ru/forums/index.php?autocom=gallery&req=si&img=6609