
Have you ever wondered how professional traders ride big trends?
You know the type of trend that keeps going higher and your profit keeps snowballing — while you do nothing.
Well, the secret is this…
They use a trailing stop loss.
You’re thinking:
“It doesn’t work.”
“I’ve used it before but the market always hit my stop loss before it trends.”
That’s because:
- You have the wrong expectations about riding a trend
- You’re using the wrong trailing stop loss technique
- Your trailing stop loss is too tight
But don’t worry.
I’ll teach you how to fix all these and more in today’s post.
PLUS, you’ll learn 5 powerful techniques to trail your stop loss so you can reduce risk and ride MASSIVE trends.
Now if you prefer, you can watch this training video below…
What is a trailing stop loss and how does it work
A trailing stop loss is an order that “locks in” profits as the price moves in your favor.
And you’ll only exit the trade if the market reverses by X amount.
This is how a trailing stop loss looks like:

Here’s a trailing stop example:
You bought ABC stock for $100 and your trailing stop loss is $10.
This means if the price goes higher to $120, your trailing stop loss is at $110 (120–10).
And you’ll exit the trade if the price drops to $110.
See how it works?
Now you might be wondering…
Why use a trailing stop loss?
Let’s be honest.
You and I both can’t predict how long a trend will last.
But what you can do is, use a trailing stop loss and take what the market offers you.
Disadvantages of Trailing Stop Loss
Now here’s the truth:
Most of the time (even if you use a trailing stop loss), you’ll not ride a trend.
Also, it’s common to watch your winners turn into losers — as the price moves in your favor and then hit your trailing stop loss.
This causes many traders to give up and they’ll claim “it doesn’t work”.
But here’s thing…
If you can endure the emotional swings, you’ll eventually catch a huge trend — possibly achieving a 1 to 20 risk to reward or more.
And this is something most traders never get to experience because “it doesn’t work” for them.
Next…
How to trail your stop loss with Moving Average
The Moving Average is an indicator that averages out the past prices and shows it as a line on your chart.
You can use it to identify the trend, filter out the “noise”, etc.
If you want to learn more, go check out The Moving Average Indicator Strategy Guide.
But for now, let’s learn how to use it to trail your stop loss.
Here’s how:
1. Decide on the type of trend you want to ride
2. Use the appropriate Moving Average
3. Exit when the price closes beyond it
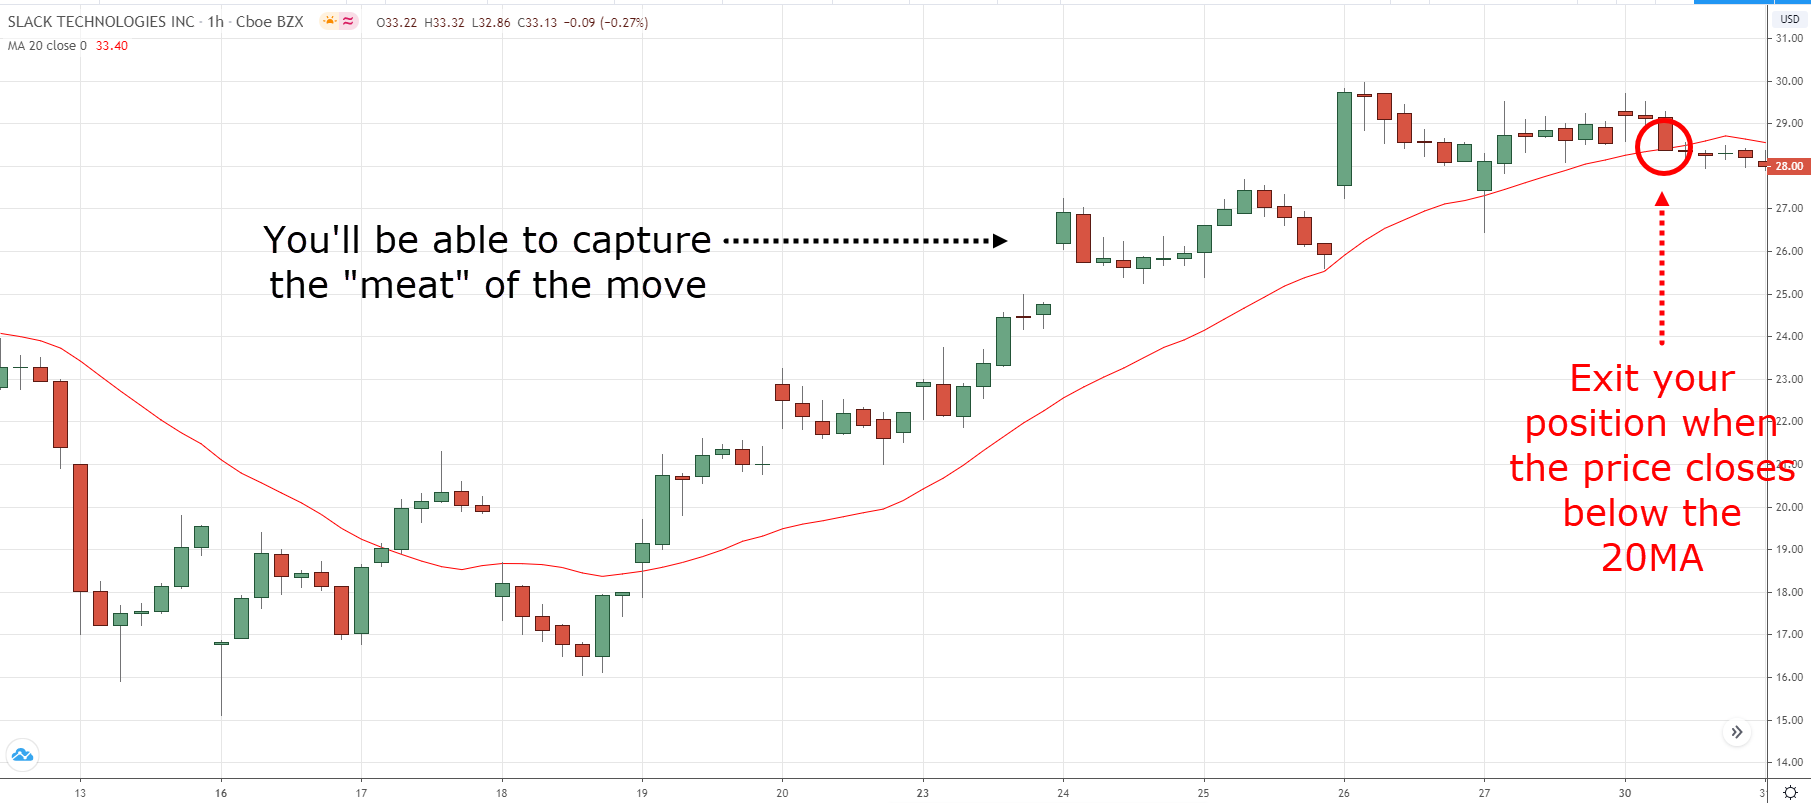
This means if you want to ride a short-term trend, you can trail your stop loss with a 20-period Moving Average (MA) — and exit your trade if the price closes beyond it.
An example…
Slack 1-Hour Timeframe:
Pro Tip:
You can use the 50-period MA to ride the medium-term trend and the 200-period MA to ride the long-term trend.
Average True Range indicator: How to use it to enormous big trends
Have you seen traders use a fixed 20 pip trailing stop loss?
It’s a joke.
Because it doesn’t consider the volatility of the markets.
Imagine having a 20 pip stop loss when the market swings an average of 200 pips a day.
It’s like flushing money down the toilet bowl.
So, what’s the solution?
You can use the Average True Range (ATR) indicator to set a volatility based trailing stop.
Here’s how it works…
1. Decide on the ATR multiple you’ll use (whether it’s 3, 4, 5 etc.)
2. If you’re long, then minus X ATR from the highs and that’s your trailing stop loss
3. If you’re short, then add X ATR from the lows and that’s your trailing stop loss
To make your life easier, there’s a useful indicator called “Chandelier stops” (from TradingView) which performs this function.
Pro Tip:
You can use 2 ATR to ride the short-term trend, 4 ATR for medium-term trend, and 6 ATR for a long-term trend.
You don’t need a chart to trail your stop loss, here’s how…
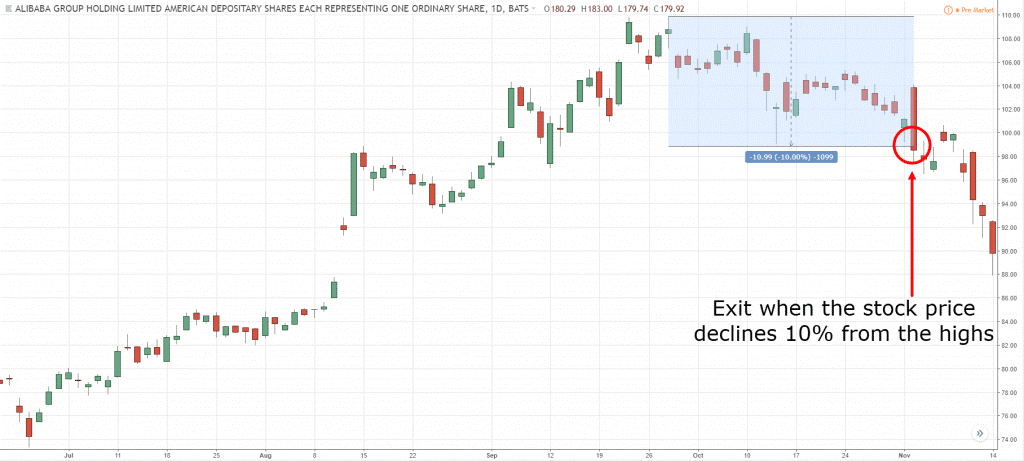
Decide on the trailing stop loss percentage where you’ll exit the trade.
It can be 10%, 20%, or whatever you decide.
For example:
If you buy ABC stock at $100 and have a trailing stop of 10%.
This means if ABC stock drops 10% (from its high), you’ll exit the trade.
An example…
Alibaba Daily Timeframe:
Pro Tip:
This technique is useful when trading a portfolio of stocks with equal weight for each position.
The zero indicator method to trail your stop loss
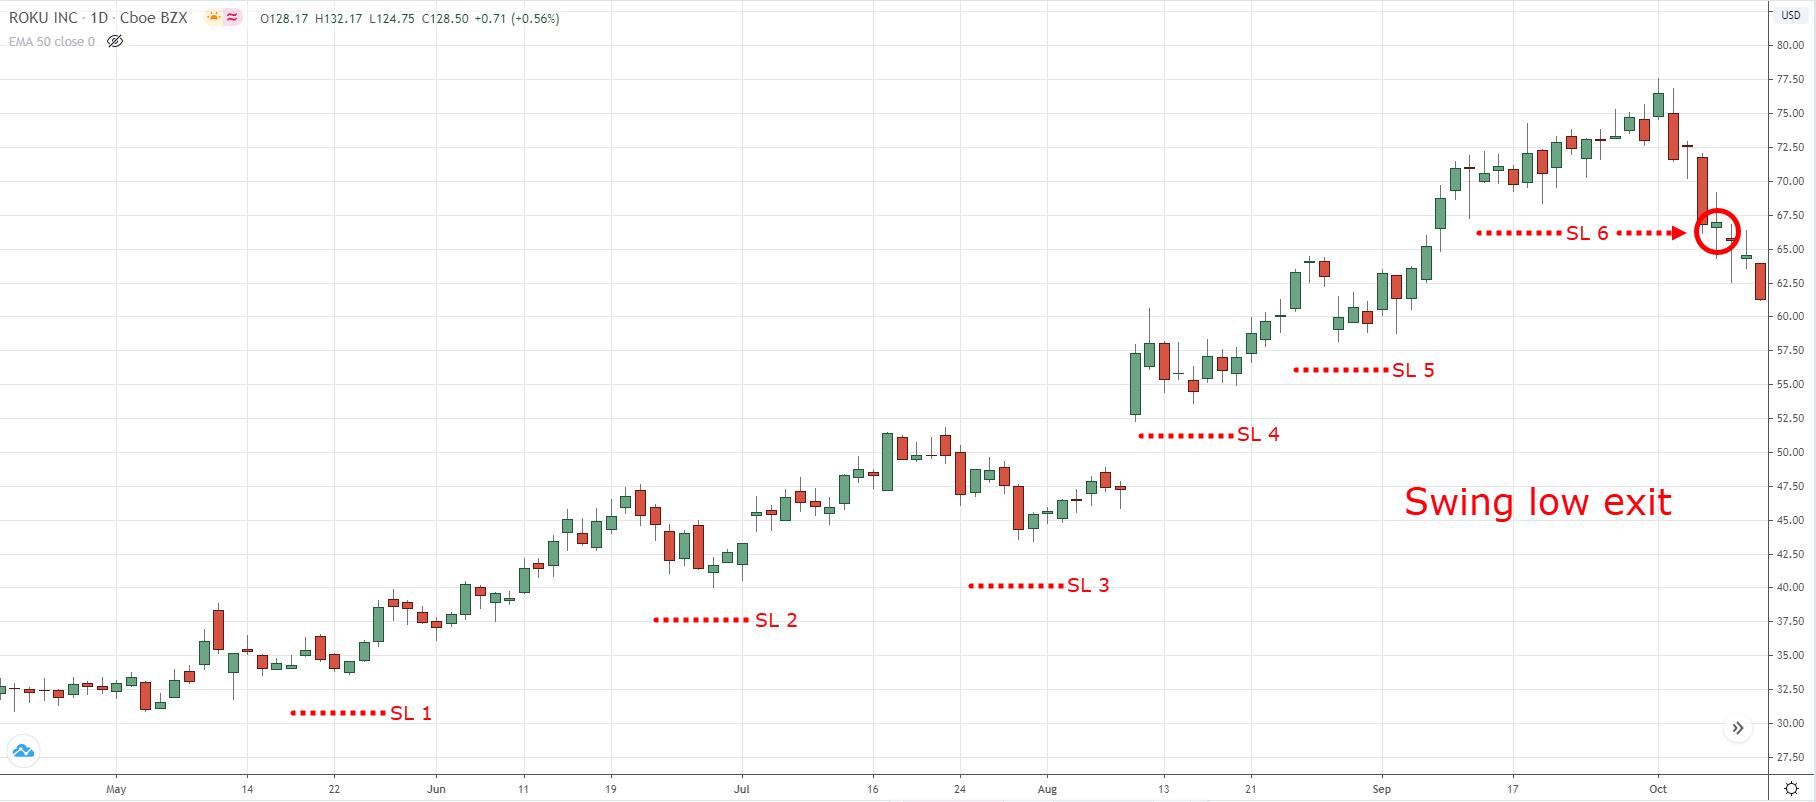
You know an uptrend consists of higher highs and lows.
This means you can use the swing low to trail your stop loss because if the trend holds, it shouldn’t close below it.
Here’s how to do it:
1. Identify the previous swing low
2. Set your trailing stop loss below the swing low
3. If the price closes below it, exit the trade
An example…
ROKU Daily Timeframe:
Pro Tip:
The market tends to “hunt” stop losses below Support or swing low.
To avoid it, set your stop loss 1 ATR below the market structure.
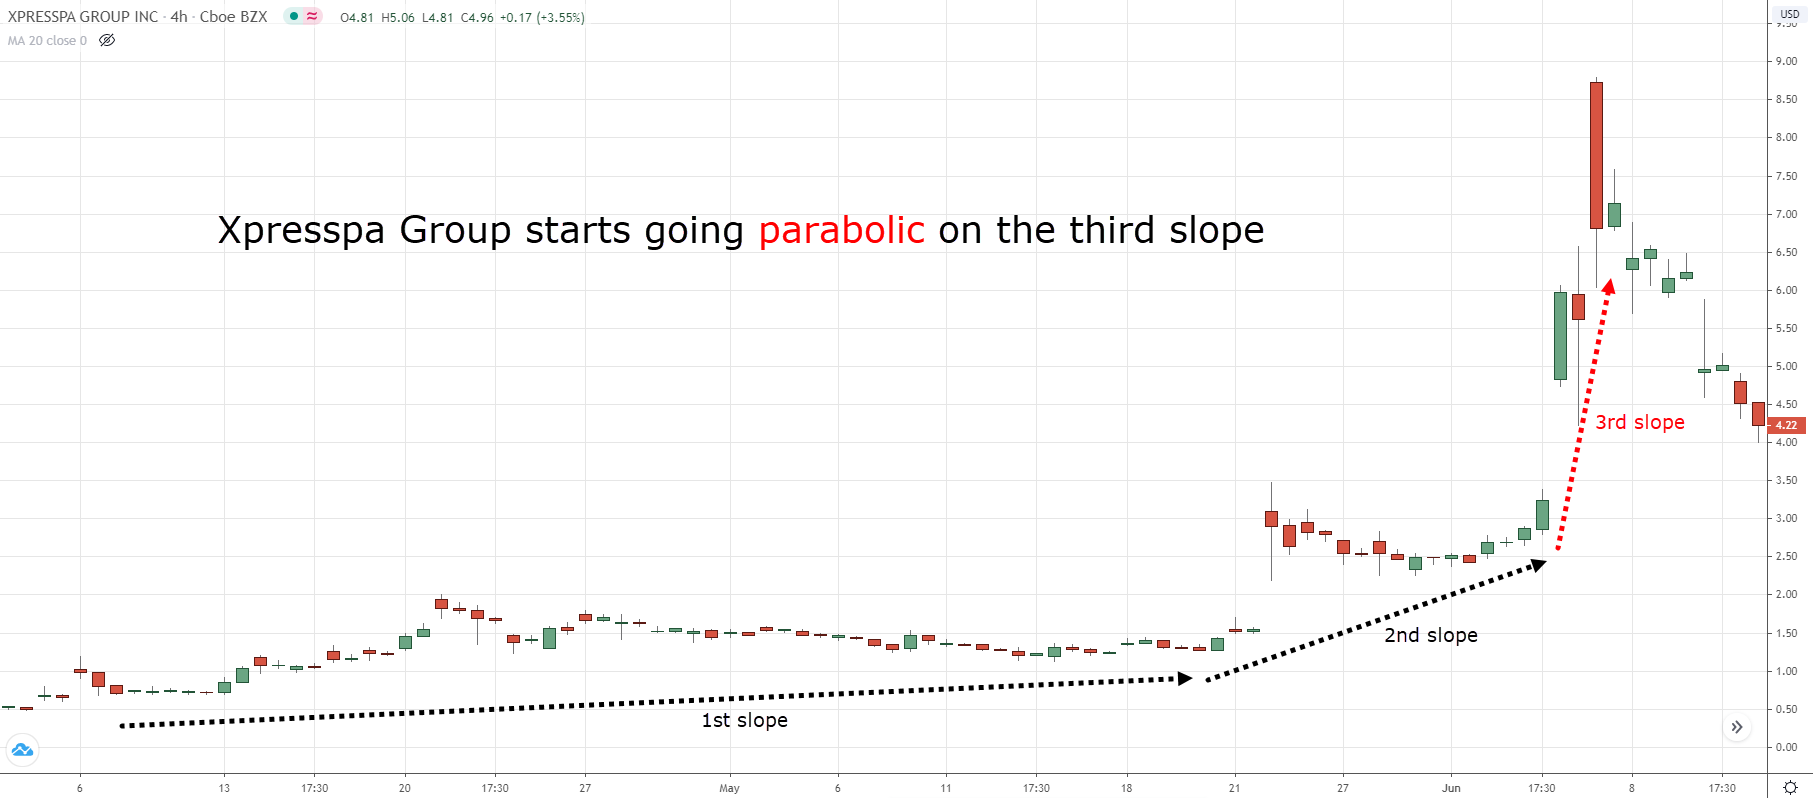
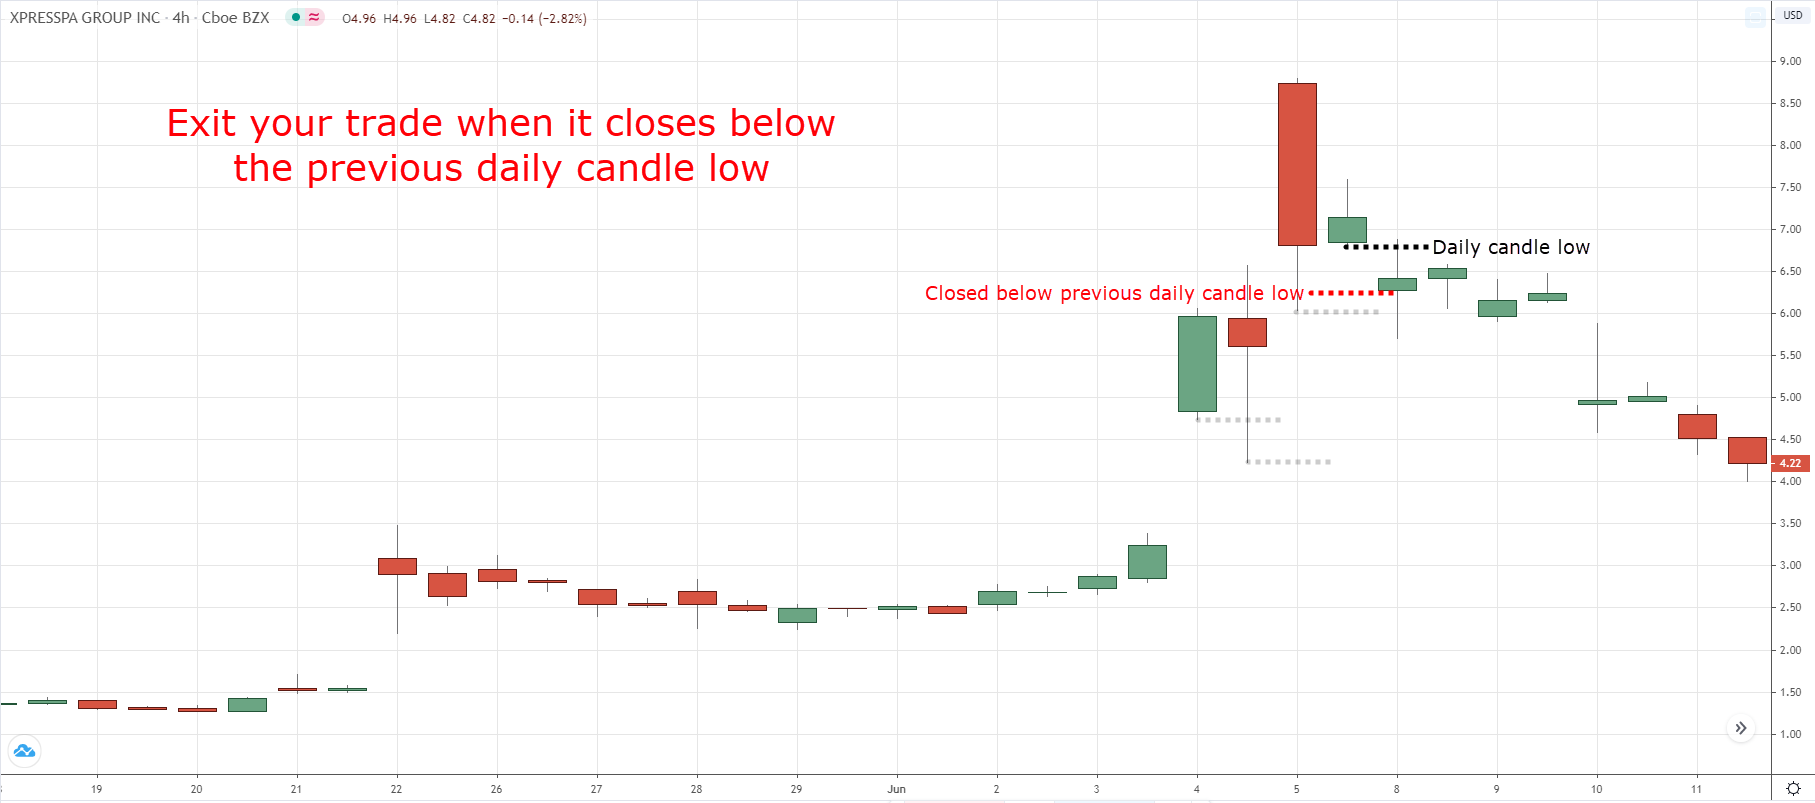
How to trail your stop loss when the market goes “crazy”
What do I mean by “crazy?”
It’s when the market goes parabolic in one straight line (like a rocket taking off).
For example…
Xpresspa 4-Hour Timeframe:
But here’s the thing:
Parabolic moves are not sustainable.
It’s a matter of time before the market reverse and COLLAPSE.
So, in market conditions like these, you want to trail your stop loss tightly.
Don’t give it too much room to breathe because you want to “run” at the first sign of cracks.
So, how do you do it?
1. Identify the timeframe of the parabolic move
2. Trail your stop loss on the previous candle low
3. Exit if the price breaks and close below it
Here’s an example…
Xpresspa 4-Hour Timeframe:
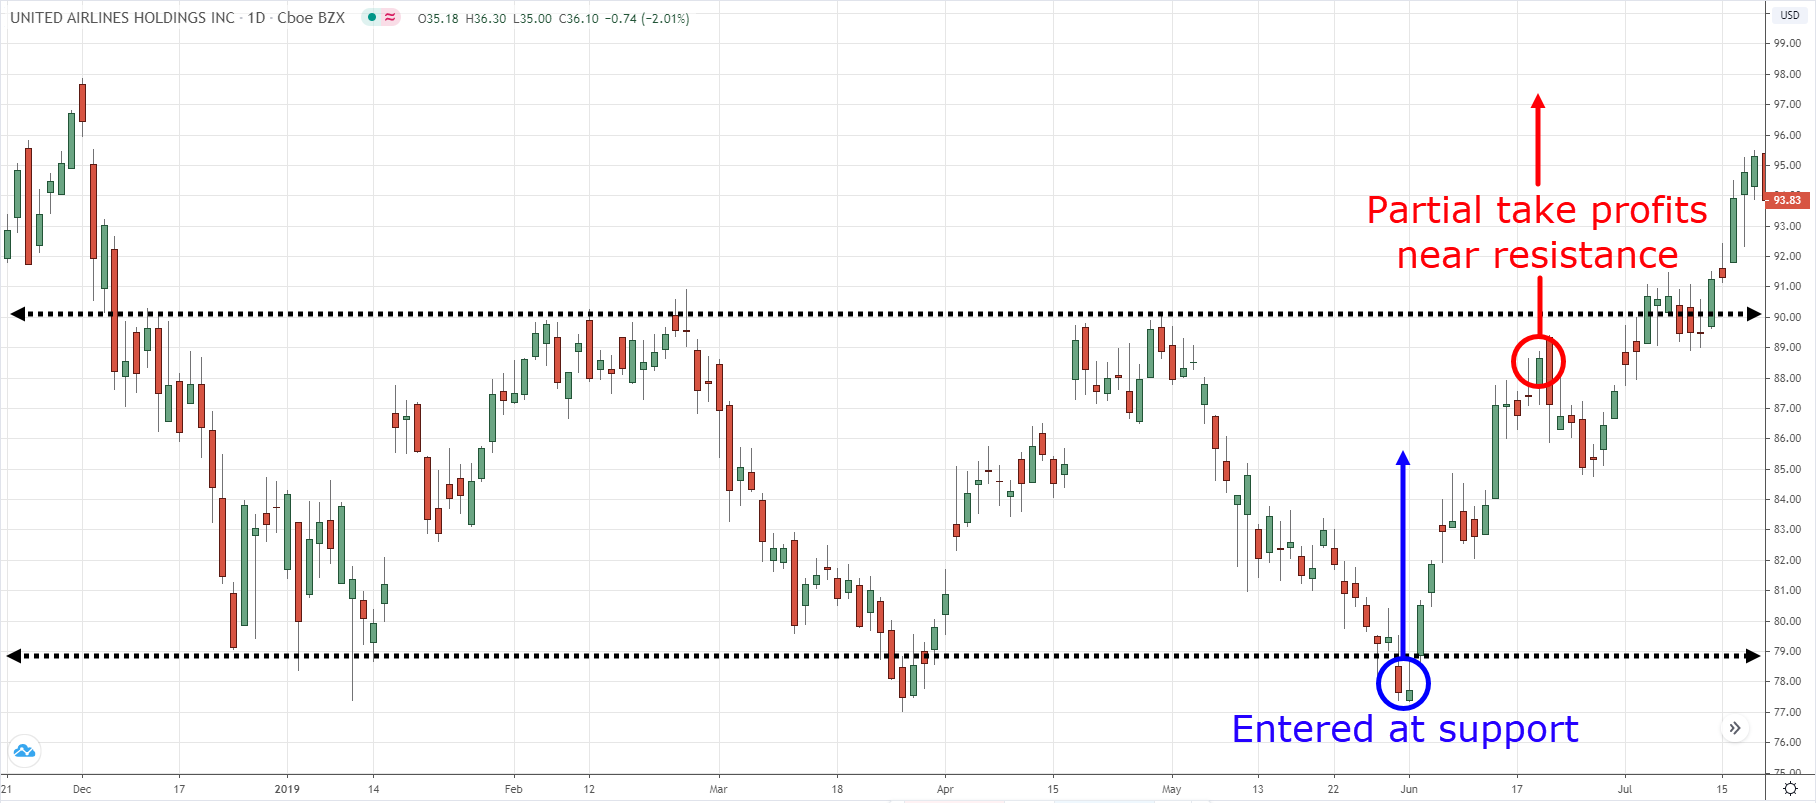
Bonus Trading Tip: How to capture a swing and ride massive trends (at the same time)
Here’s the thing:
There’s no rule to say you must either capture a swing or ride a trend.
Instead, you can do both!
This means you have the consistency of a swing trader plus, the ability to ride big trends (like a Trend Follower).
So, how does it work?
Simple.
You exit a portion of your trade at a fixed target and let the remaining ride the trend.
Here’s an example…
United Airlines Daily Timeframe:
Now, there are two things to consider…
- How many units do you sell at your fixed target?
- How will you manage the remaining units?
Let me explain…
1. How many units do you sell at your fixed target?
Here’s the thing:
If you sell too little units, it becomes a Trend Following trade.
And if you sell too much, it becomes a swing trade.
For starters, you can sell 50% of your position at the first target and keep the remaining to ride a trend.
Once you’re proficient with this technique, you can “play around” with the percentage to suit your goals.
2. How will you manage the remaining units?
You’ve hit your first target profit, yay!
What now?
Will you attempt to ride a trend or have a second target profit?
If you have a second target profit, where will it be?
If you want to ride a trend, how will you trail your stop loss?
Clearly, those are questions only you can answer (and it depends on your goals and personality).
So think about it.
Now you might be wondering…
Which is the best strategy to trail your stop loss?
I’ll be honest.
There’s no best trailing stop strategy.
Because it depends on what YOU want from your trading.
For example:
To ride a short-term trend, you can trail with 20-period MA, 2 ATR, etc.
To ride a medium-term trend, you can trail with 50-period MA, 4 ATR, etc.
To ride a long-term trend, you can trail with a 200-period MA, 6 ATR, etc.
Do you see my point?
The most important question to ask is…
What’s the type of trend you want to capture?
Then use the right technique to achieve your goal.
Conclusion
- A trailing stop loss is an order that “locks in” profits as the price moves in your favor
- You can trail your stop loss using: Moving Average, Average True Range, percentage change, market structure, and weekly high/low
- There’s no best method to trail your stop loss. Instead, ask yourself what’s the type of trend you want to capture and then use the right technique for it
Now here’s my question to you…
How do you trail your stop loss and ride the trend?
Leave a comment below and share your thoughts with me on trailing stop loss.
I always enjoy your forex teaching style. Very simple, detailed and easy to comprehend. You are indeed doing fantastically great. Kudos
I’m glad you were able to benefit from the guide Emeka!
Simple and elaborate presentation!
Want to know of the trading Platform which is good and safe for beginners, user-friendly and with adequate information and applications.
Thank you
Hey there Sunil, we don’t usually discuss brokers out here in the open, so feel free to email me at support@shootingstocks.com so that we can discuss further!
Well, what can I say expect thank you Rayner …..your teaching are very simple.
Hopefully your teaching can make us more profitd
Awesome to hear the Ifeanyi, you’re welcome!
Language – simple
Content – concise and instructive.
Really appreciate.
Thanks so much sir.
Emma from Enugu, Nigeria.
Great, thank you for the feedback Emmanuel!
Thanks guys you are truly amazing
Thank you for the kind words, Mayowa!