
This post is written by Jet Toyco, a trader and trading coach.
Whenever you search the internet on “how to read price action” as a beginner…
Chances are, you will see concepts that already require you a certain amount of experience to understand well.
That’s why in this comprehensive guide, you’ll learn:
- How to identify market structures even if you have almost zero knowledge of charts
- How to detect new trends and trend reversals with pinpoint accuracy
- A simple price action trading strategy that works without the aid of technical indicators
So that by the end of this article, you’ll never see your charts the same way ever again.
Let’s get started…
How To Read Price Action of Market Structures
Here’s the truth:
Plotting and identifying market structures takes practice.
However, it’s the most basic yet essential thing you must learn to read price action.
Why, you may ask?
Because it’s the foundation of being able to identify trends, patterns, where to set your take profit, stop loss —you name it!
So here are the market structure terms you must know:
- Higher High
- Higher Low
- Lower High
- Lower Low
Let me explain…
(I will highlight those terms throughout to make it easier to follow through the examples)
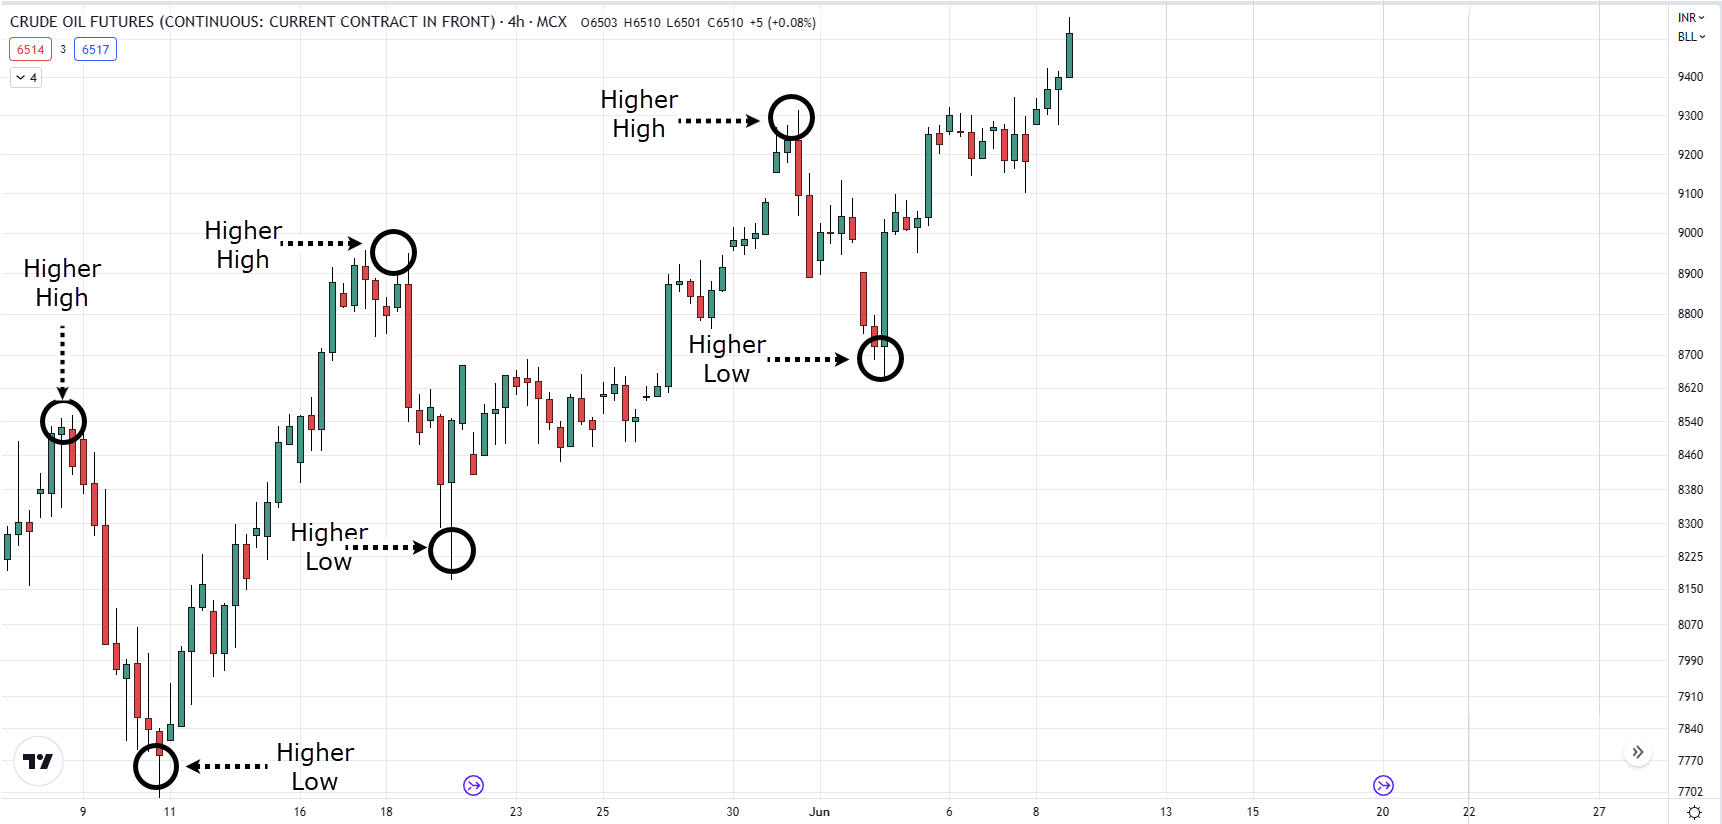
Higher Highs and Higher Lows
To put it simply…
Higher highs are “peaks” on your chart that are higher than the previous peak.
On the other hand, higher lows are “bottoms” on your chart that are higher than the previous bottom.
Here’s what I mean…
Crude Oil Futures 4-hour Timeframe:
I’m sure you’re wondering…
“When exactly do I know if it’s a valid higher high or a valid higher low?”
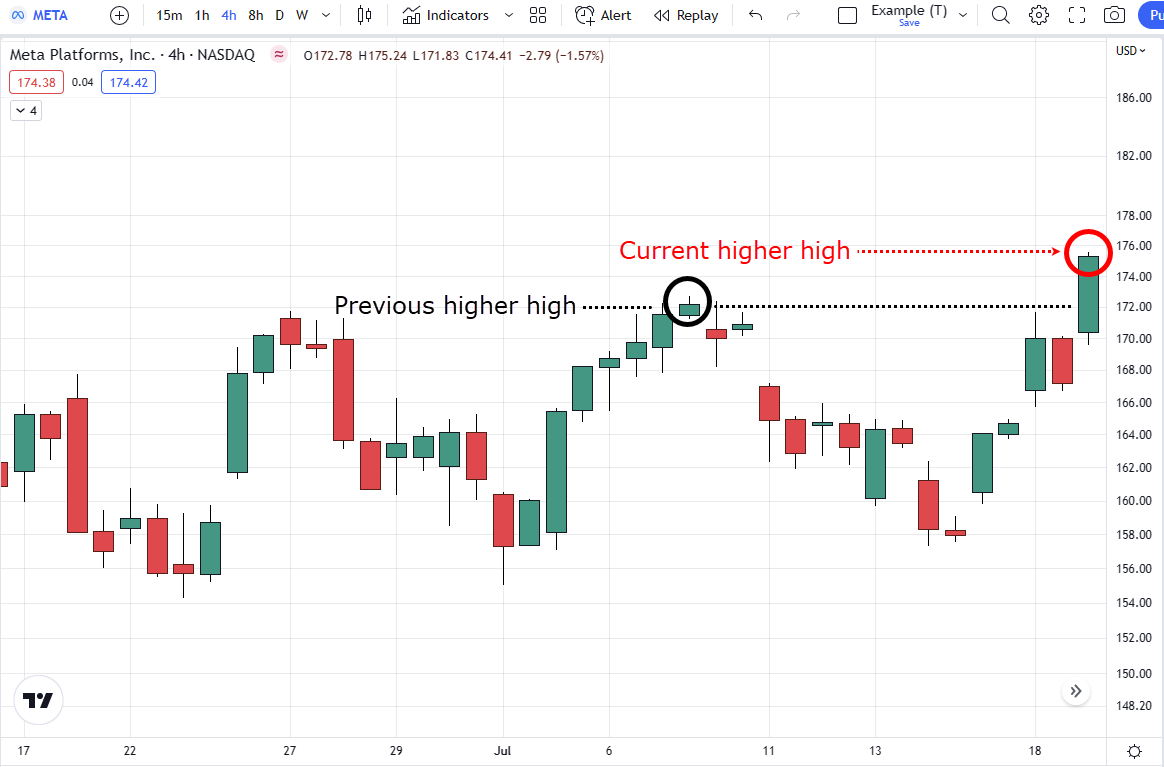
Good question, I want you to pay attention because this is going to be very important:
If the market exceeds the previous high and then closes…
Then you can consider it the current higher high.
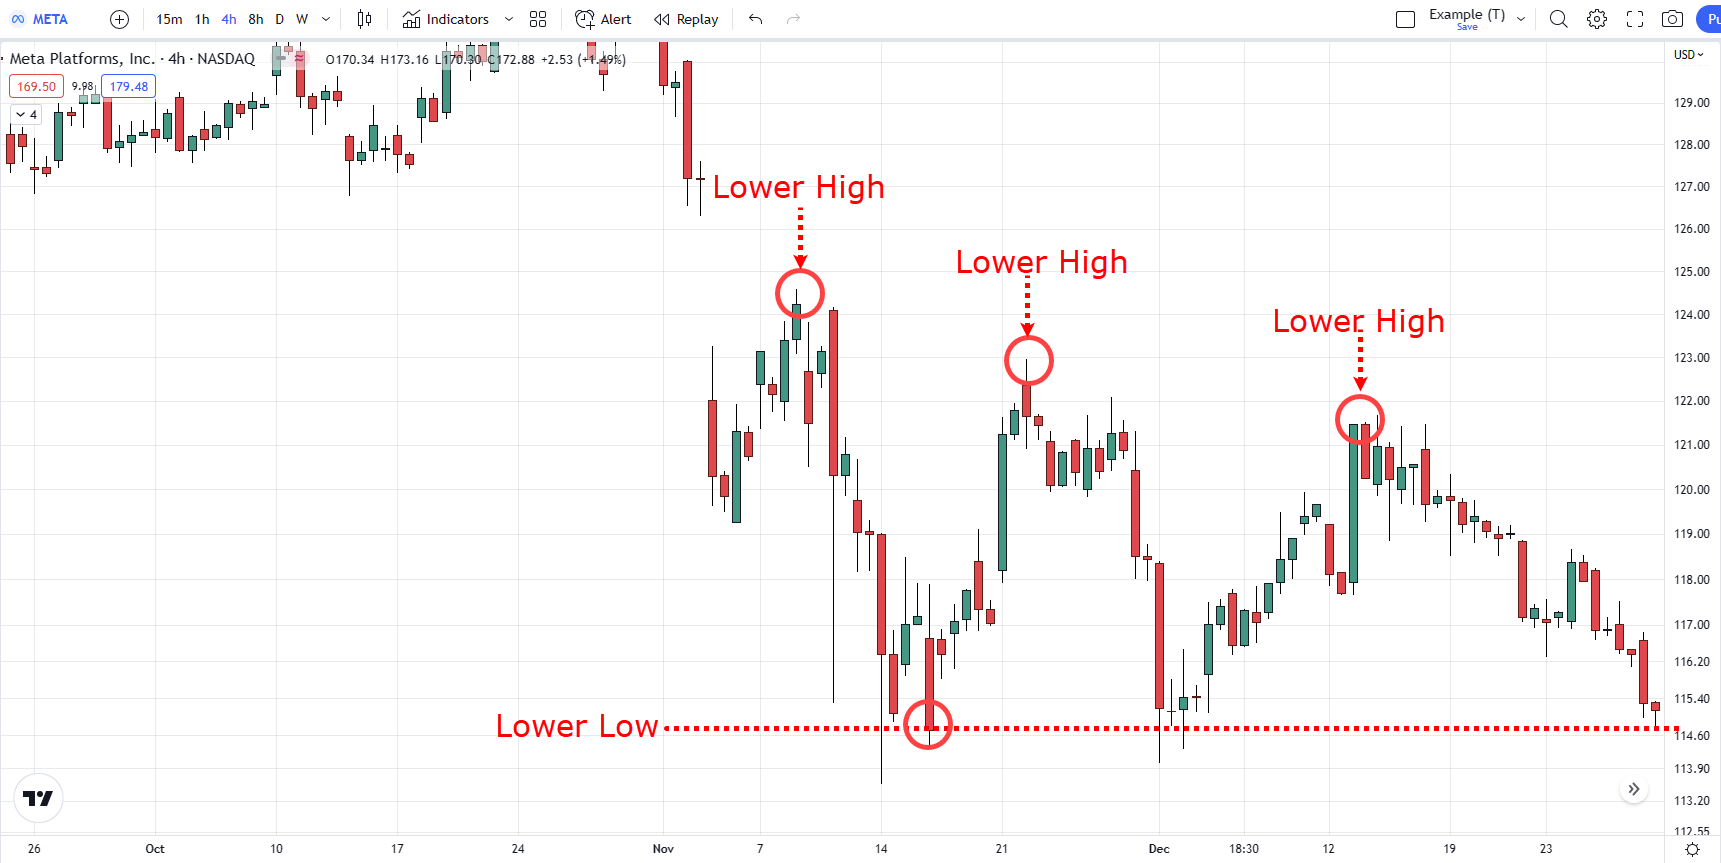
Meta Platforms, Inc. 4-hour timeframe:
On the other hand…
If the market is currently on a decline but has not exceeded its previous higher low, then you can consider it the current higher low.
Alphabet Inc (Google) 4-hour timeframe:
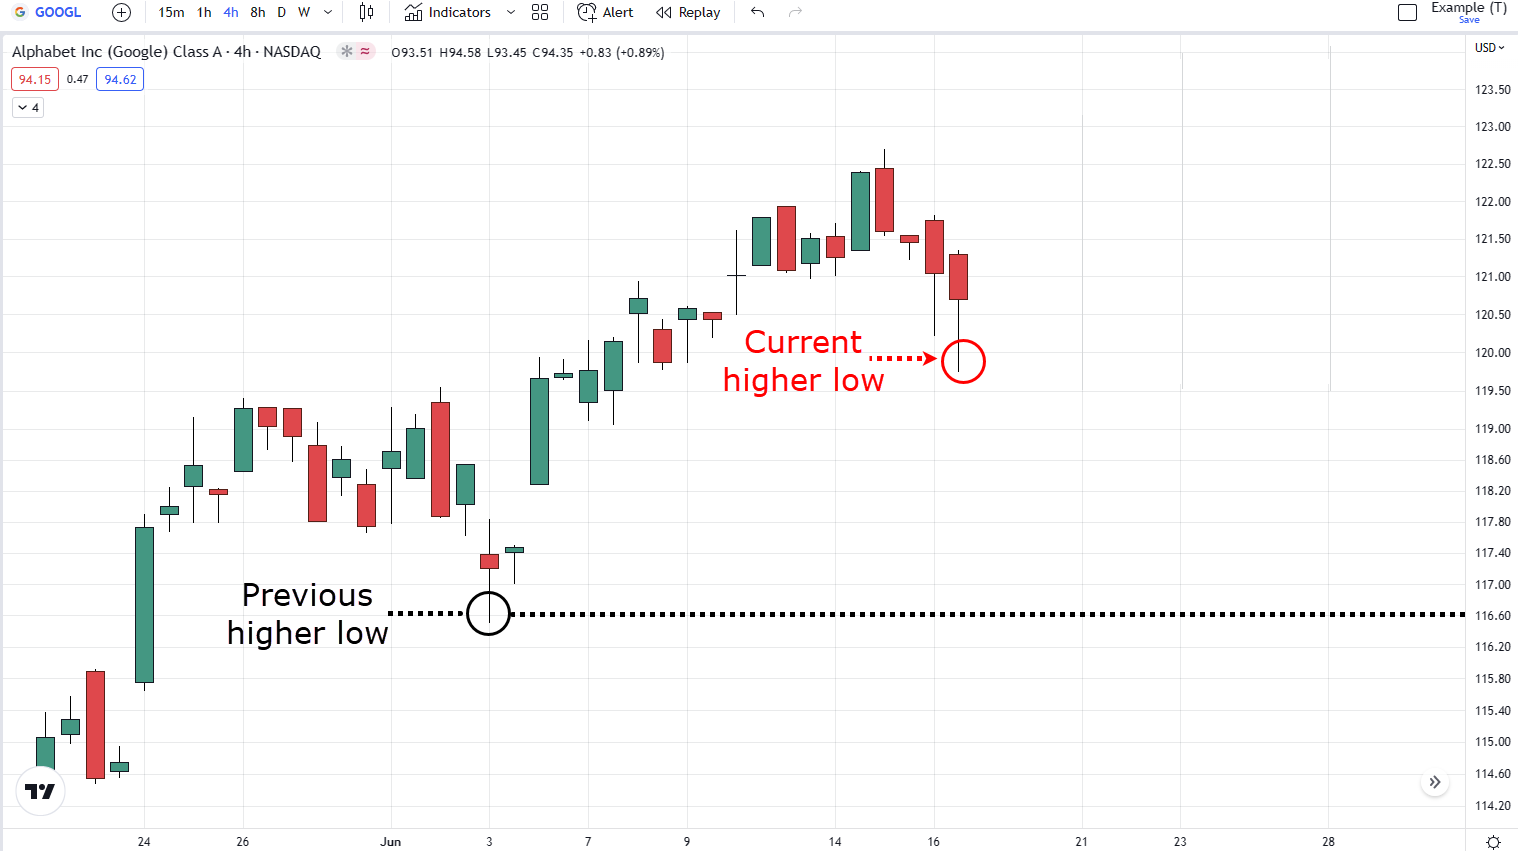
Again, as long as it does not goes below the previous higher low, it’s still a valid current higher low.
Got it?
But the question is…
What if the current higher low goes below the previous higher low?
The answer is that the market structure has now been broken and would now be called a “Lower Low.”
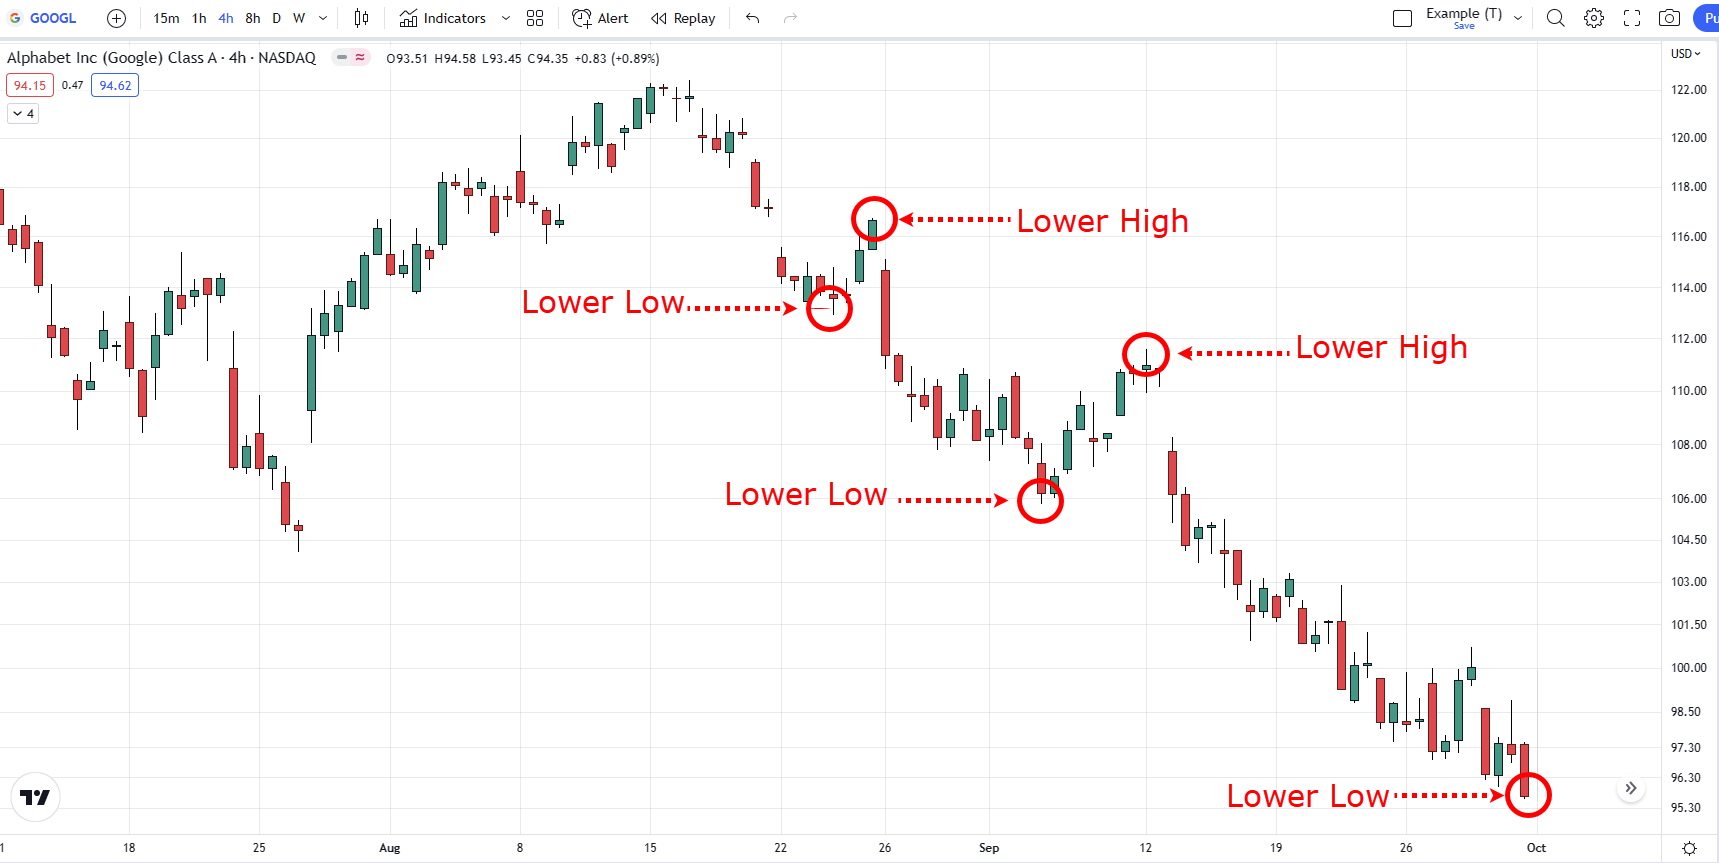
Alphabet Inc (Google) 4-hour timeframe:
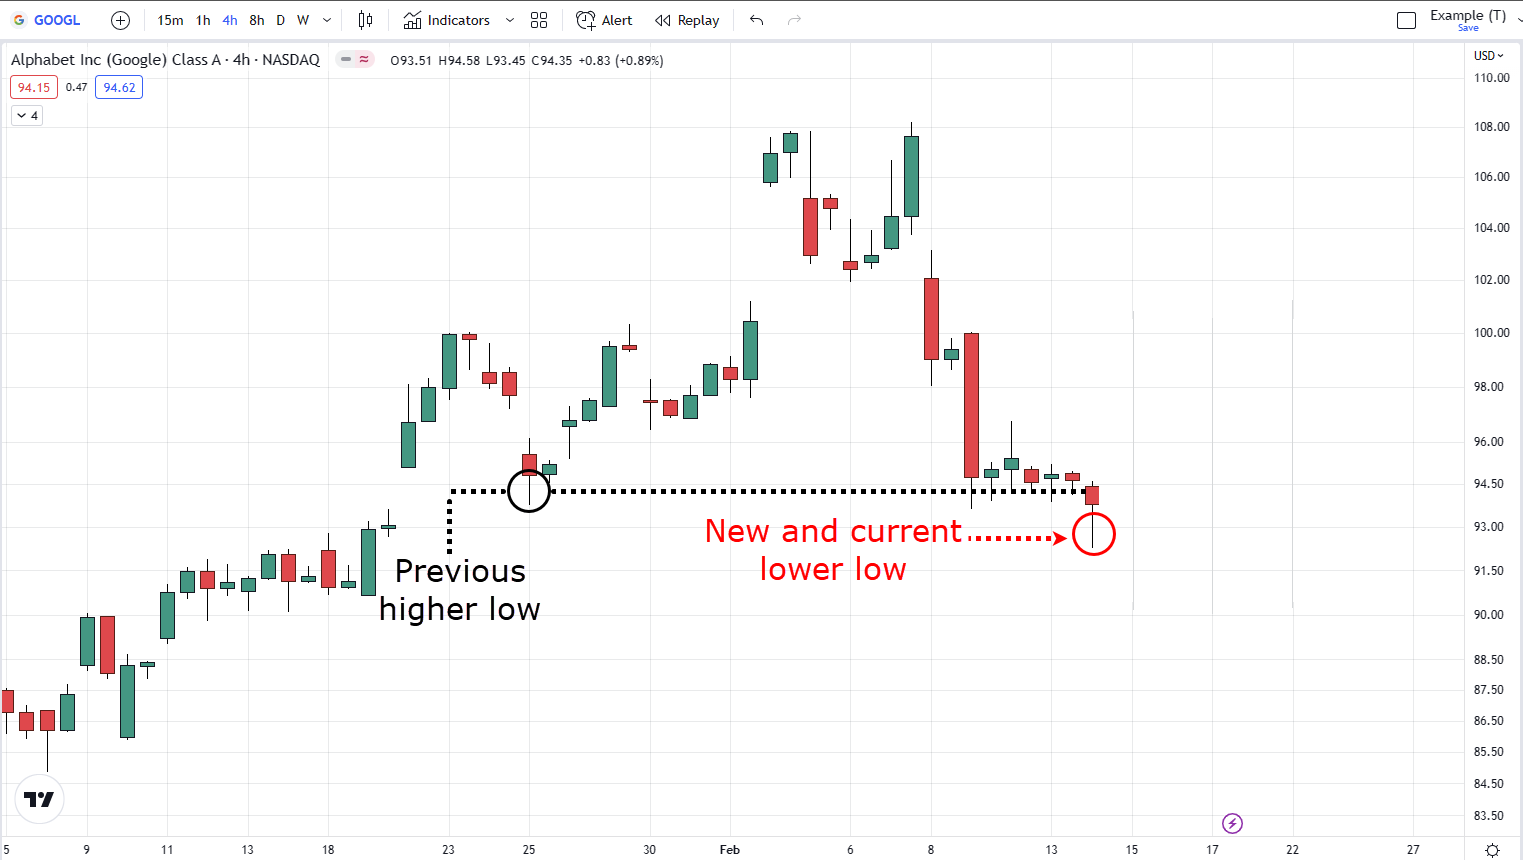
Keep reading, and I’ll tell you more about it…
Lower Lows and Lower Highs
In contrast to the previous market structures, lower lows are “bottoms” on your chart that are lower than the previous bottoms.
On the other hand, lower highs are “peaks” on your chart that are lower than the previous peak.
Alphabet Inc (Google) 4-hour Timeframe:
Now, when do we exactly know when they happen?
You might ask:
“It’s a valid lower low if it closes below the previous lower low, right?”
You’re right.
However, new lower lows can also happen once they exceed below higher lows.
SUGAR 8-hour Timeframe:
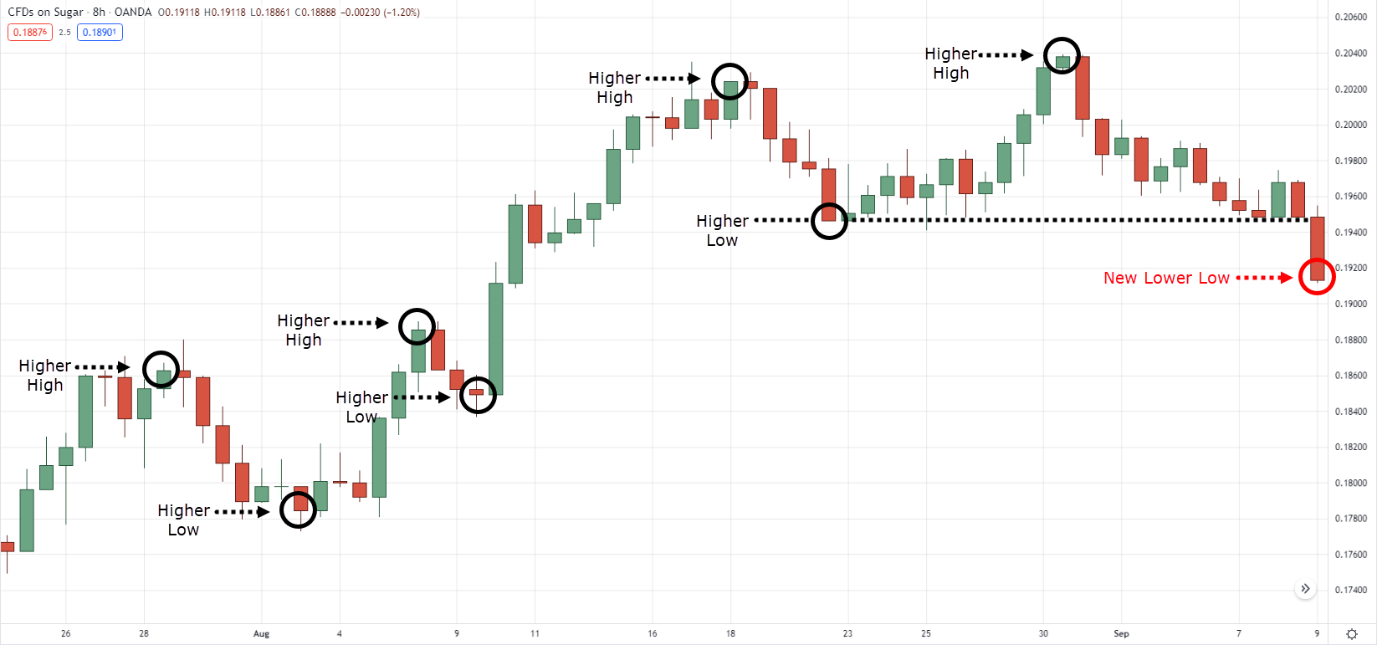
On the other hand, lower highs can repeatedly happen even though no new lower lows are made.
Meta Platform, Inc. 4-hour timeframe:
With that said…
Let’s do a bit of an exercise, shall we?
Looking at the chart of EURUSD on the daily timeframe…
I’d like you to identify current and past:
- Higher Highs
- Higher Lows
- Lower Highs
- Lower Lows
Without looking at the next section.
Ready?
Good luck, and take your time…
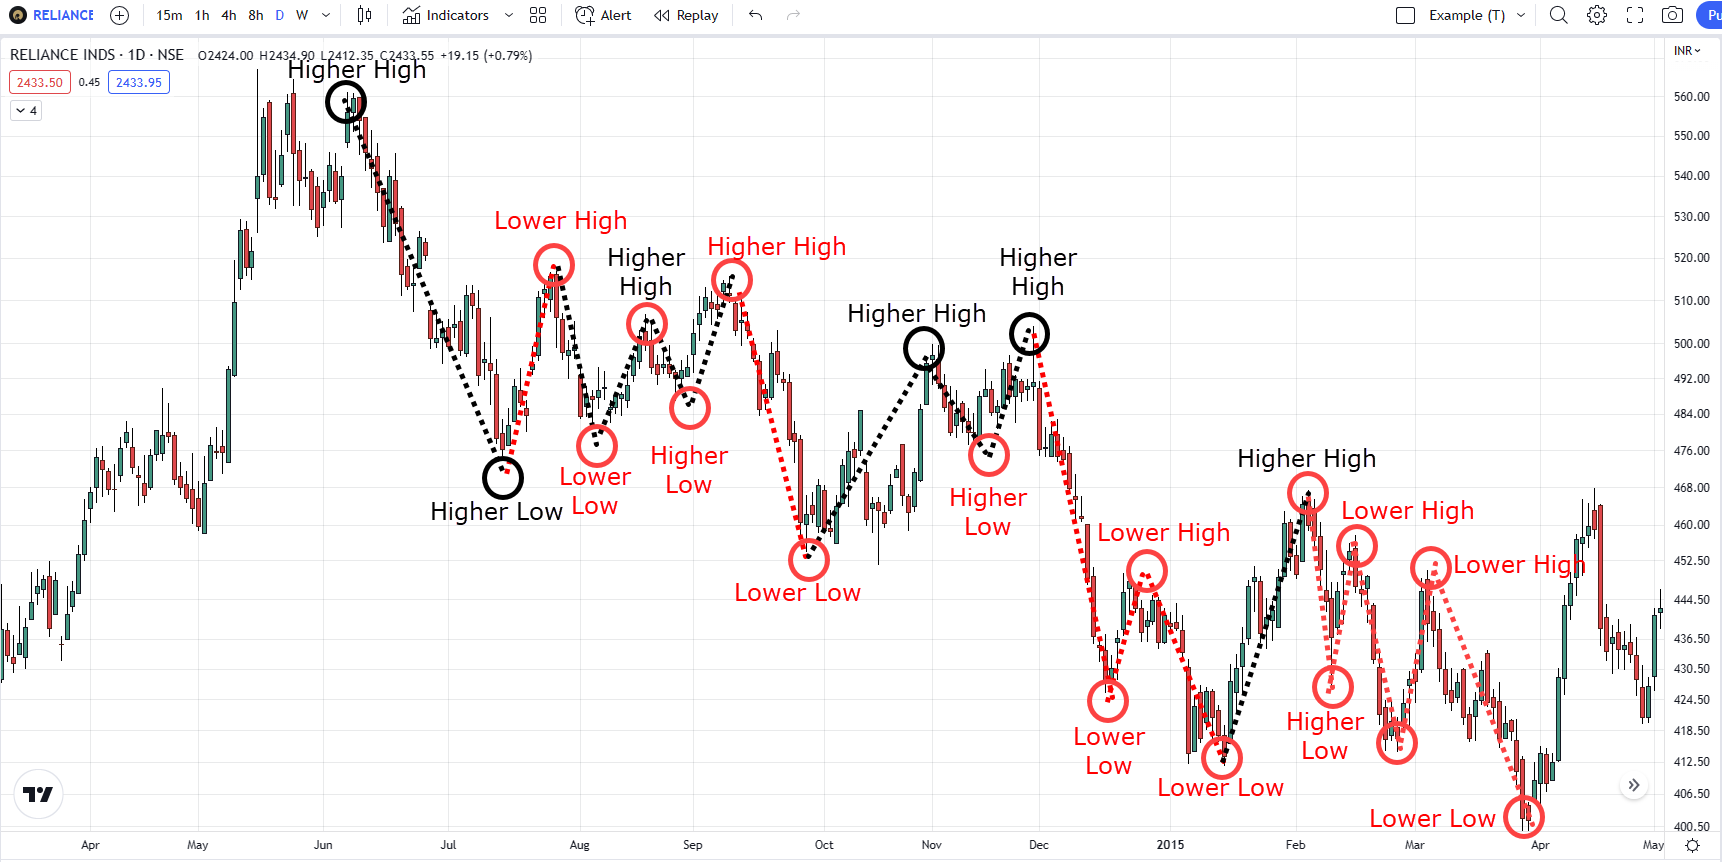
RELIANCE INDS Daily Timeframe:
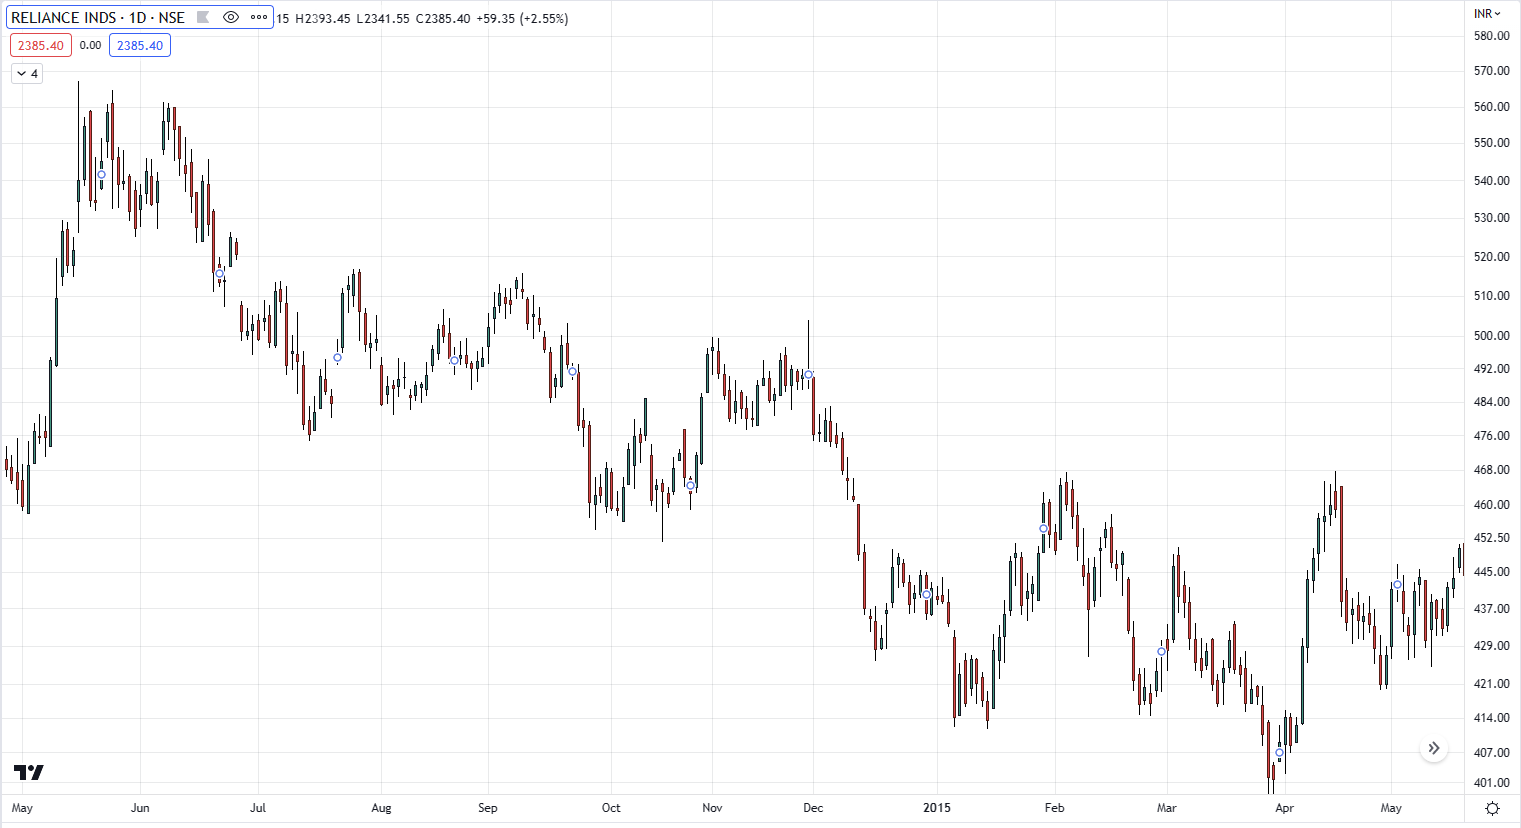
You finished?
Final answer?
If so, then let’s compare it to what I see right now…
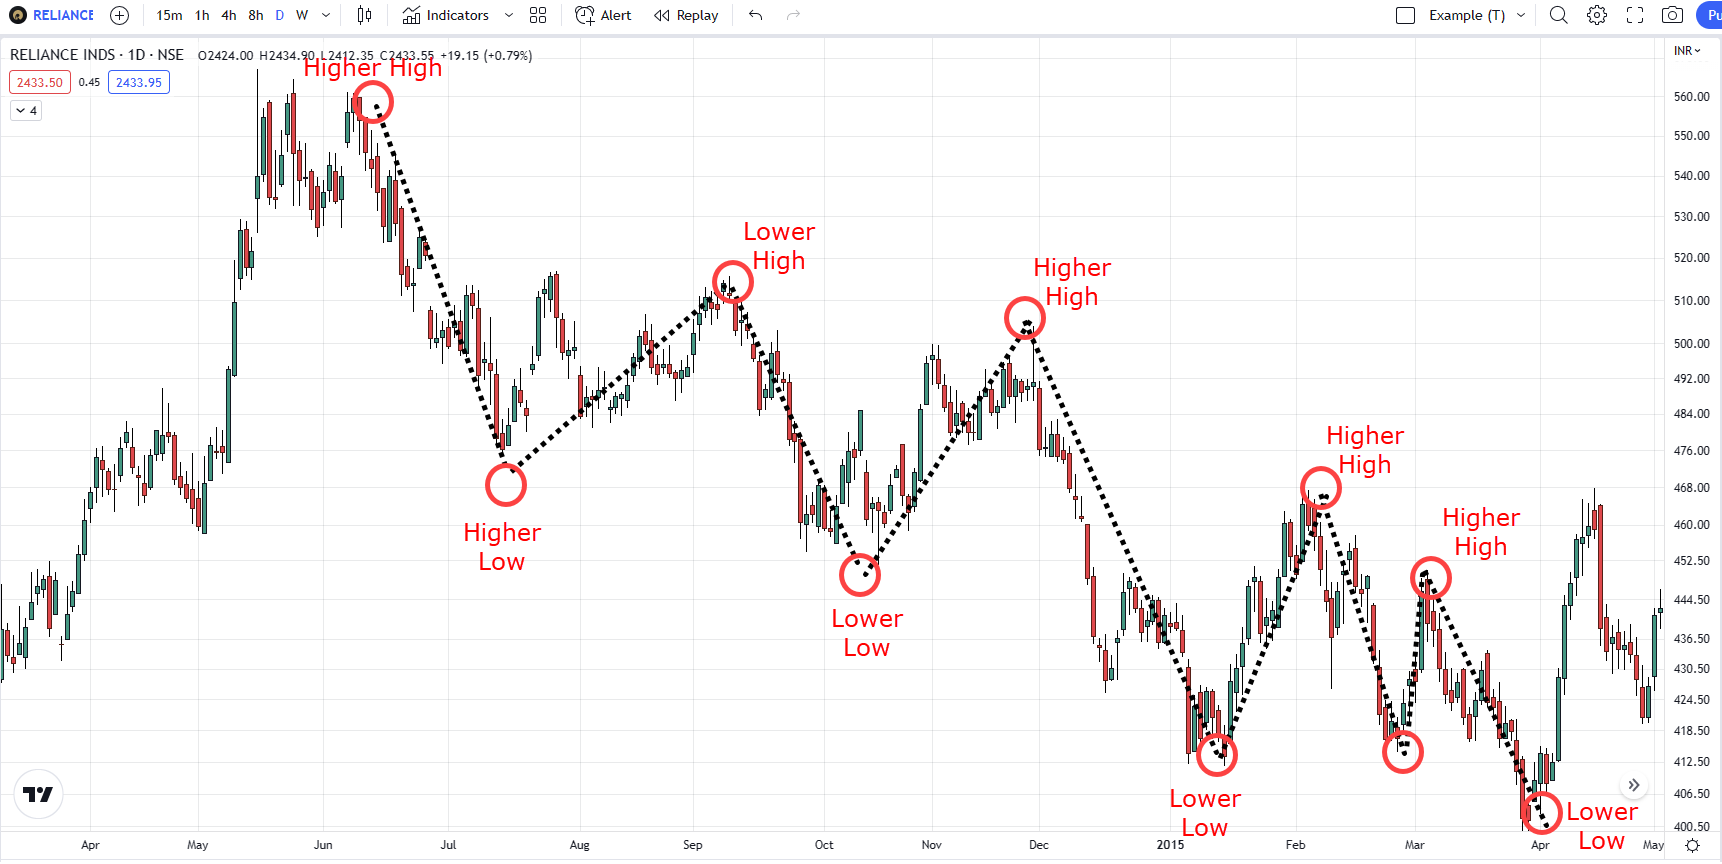
RELIANCE INDS Daily Timeframe:
Now…
I know that there’s a high chance that what you’ve plotted won’t be the same as mine.
But that’s okay.
Because two traders can see different things, yet both can still be correct.
For example, these market structures are also correct…
RELIANCE INDS Daily Timeframe:
Makes sense?
The question on your mind right now might be:
“Cool, but how can I use this concept actually to trade the markets? I need answers, now!”
Alright, alright, I get you.
In the next section…
I will teach you how to read price action of different market conditions—when they start and when they can potentially end.
Sounds good?
Then keep reading…
Market Conditions: What Are They, When to Define Them, and When do They End
I’m sure you’ve already heard before:
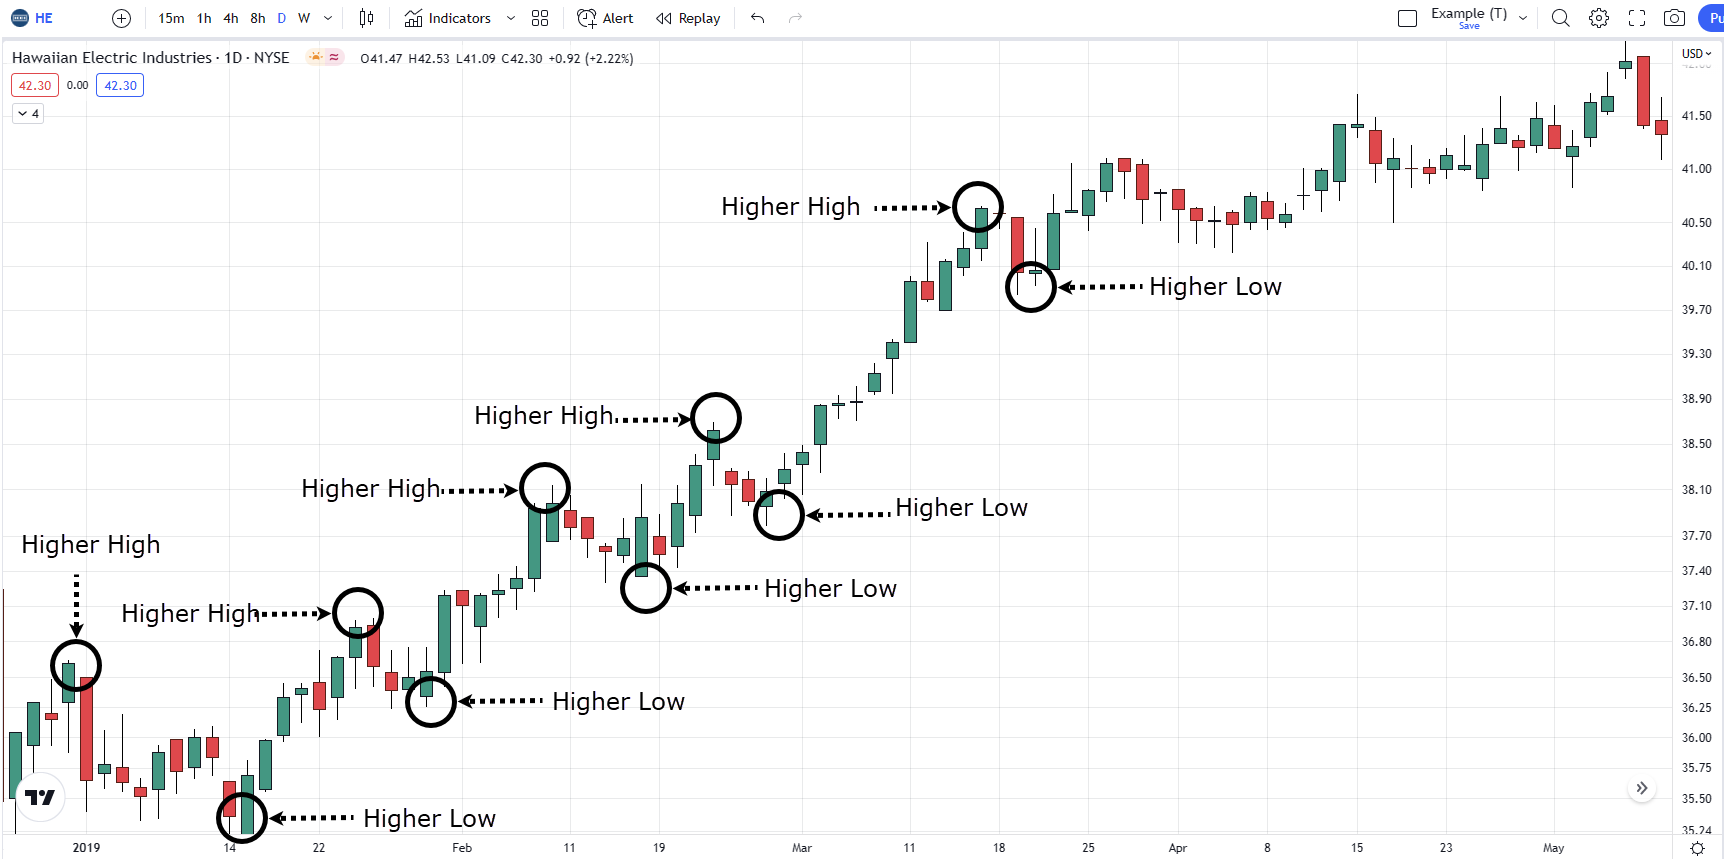
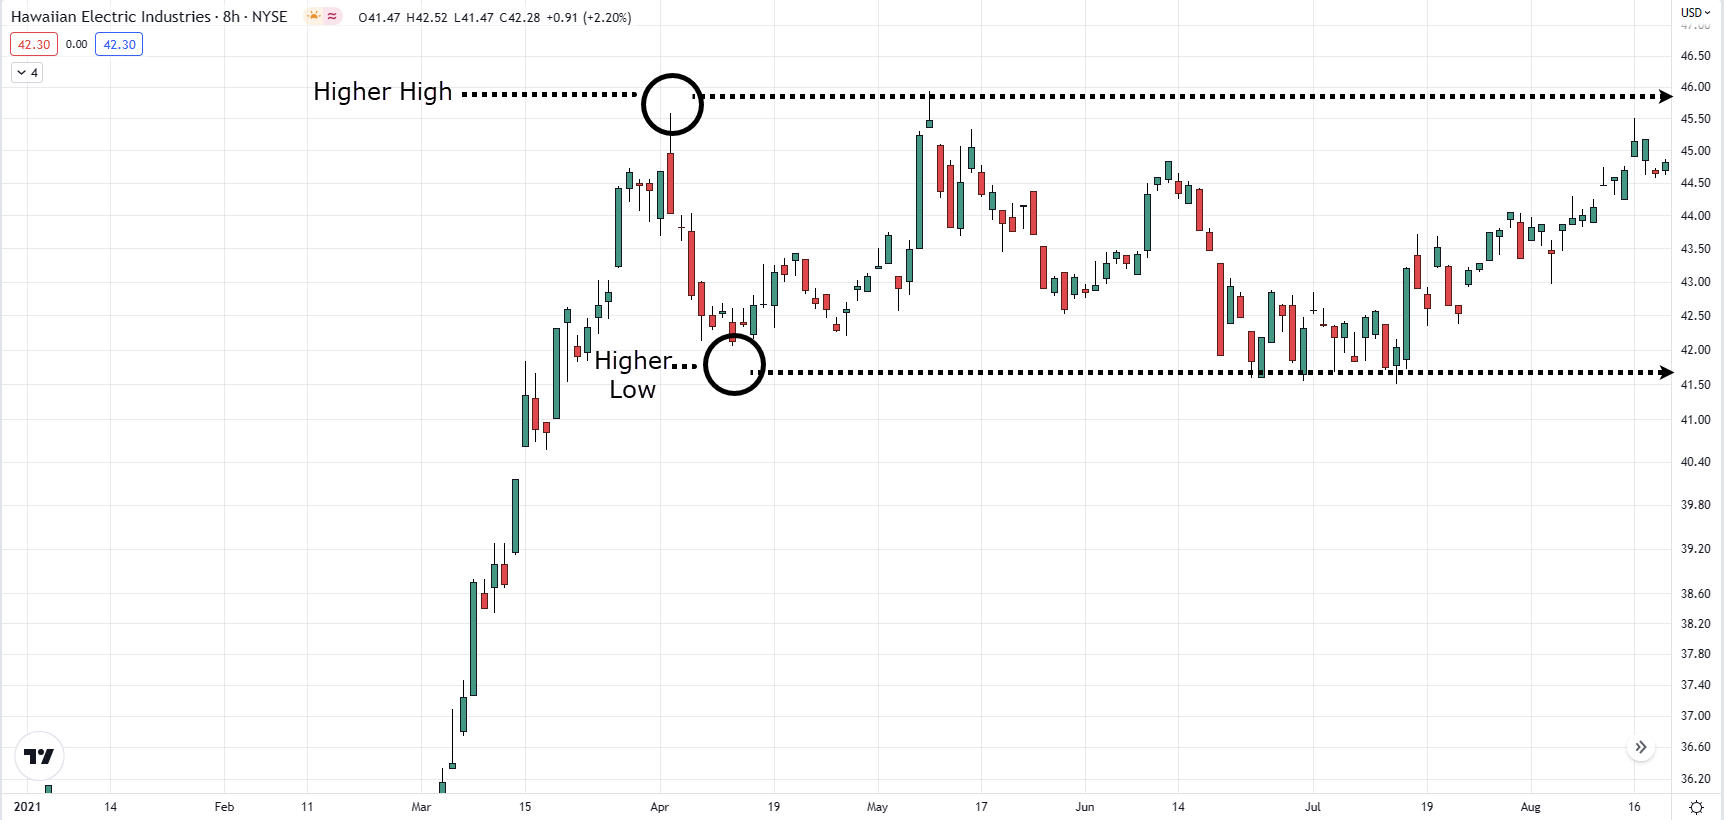
An uptrend consists of higher highs and higher lows…
HAWAIIAN ELECTRIC IND Daily timeframe:
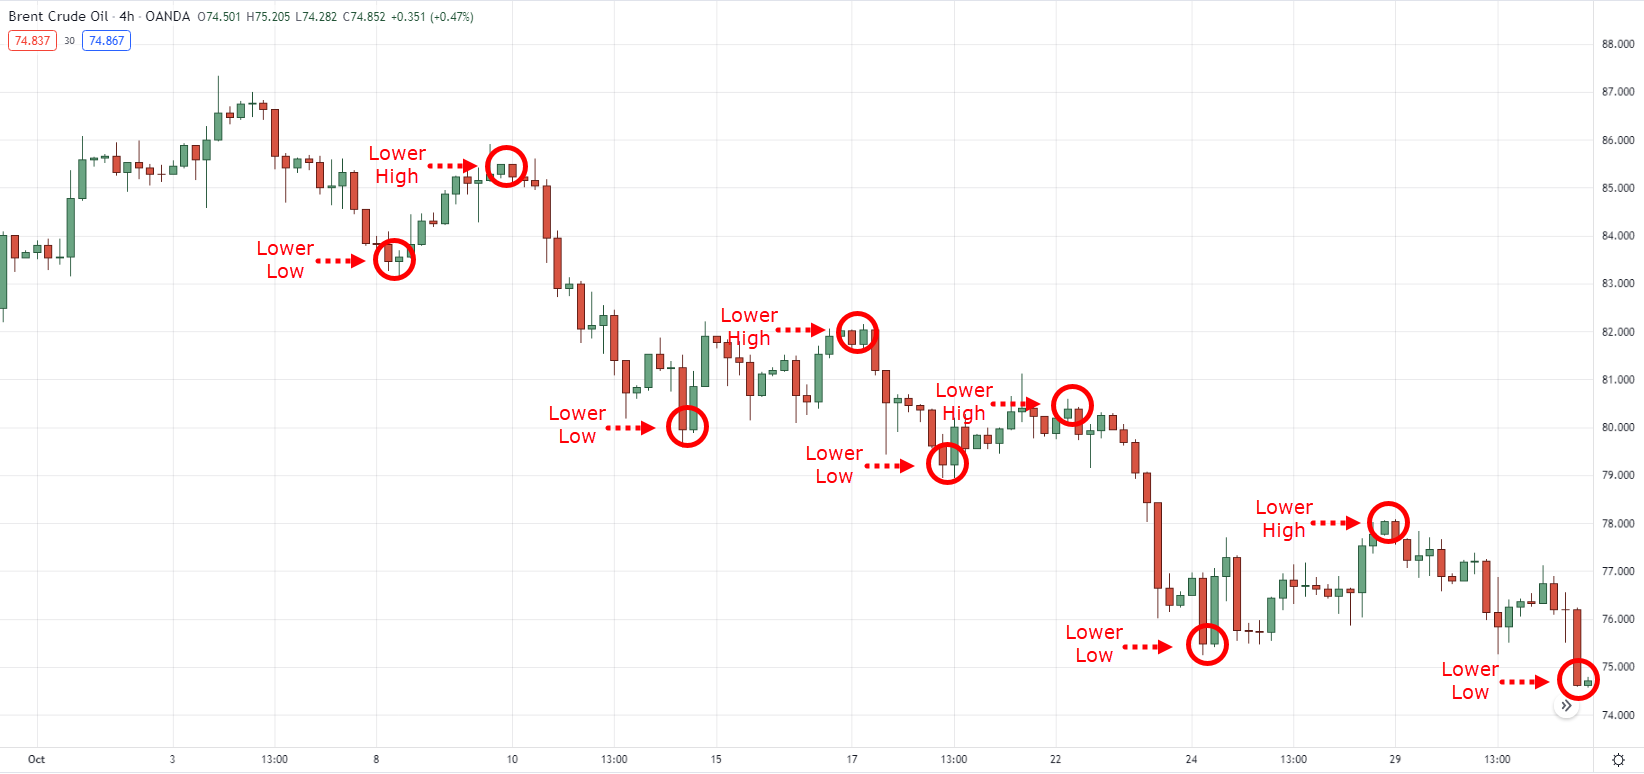
A downtrend consists of lower highs and lower lows…
Brent Crude Oil 4-hour Timeframe:
Finally, a range is when the price is contained between the highs and lows…
HAWAIIAN ELECTRIC IND 8-hour Timeframe:
However, the critical question not many would dare answer is:
“When exactly do trends start, and when exactly do they end?
Let me answer them right now…
Uptrend
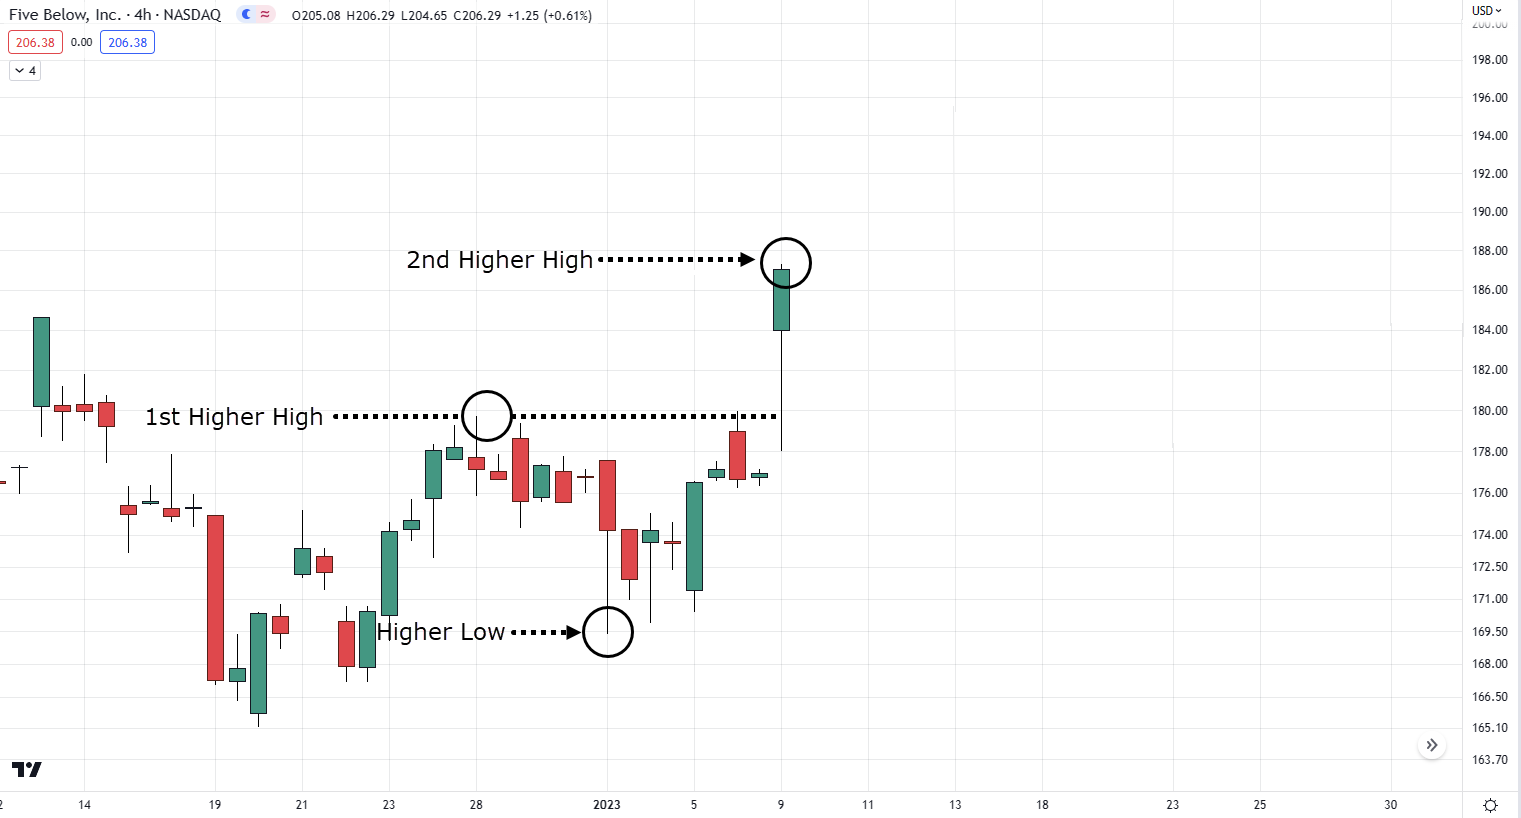
In terms of market structure, a valid uptrend is when the price makes a 2nd higher high, which indicates that price can potentially go higher…
Five Below 4-hour Timeframe:
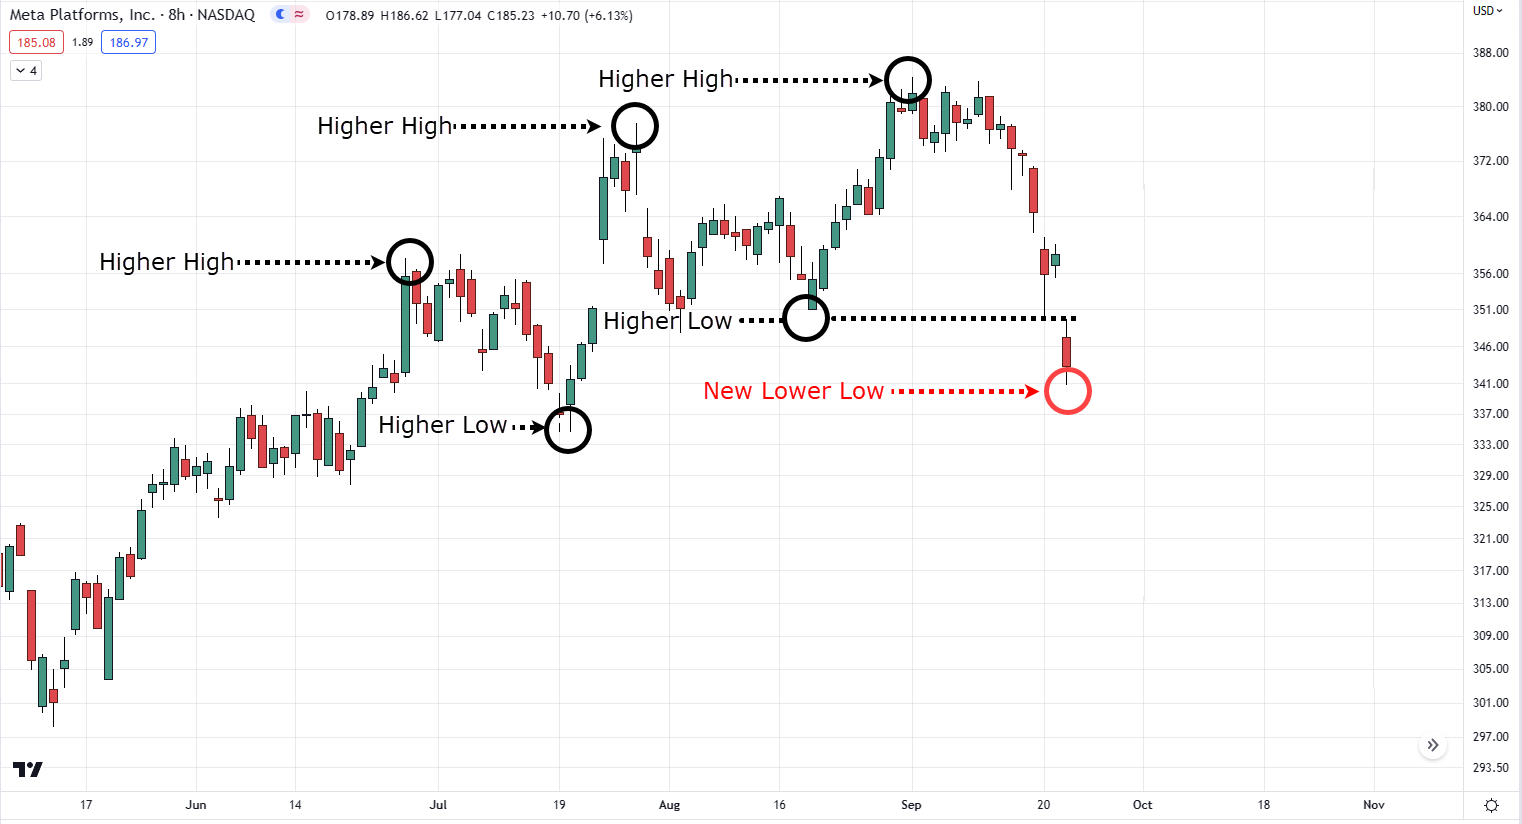
While an uptrend is invalidated once the price exceeds and closes below the higher low (therefore making a new lower low), which indicates that the price can potentially go lower…
Meta Platforms Inc 8-hour Timeframe:
Downtrend
If you look at the previous chart example, is it already a valid downtrend?
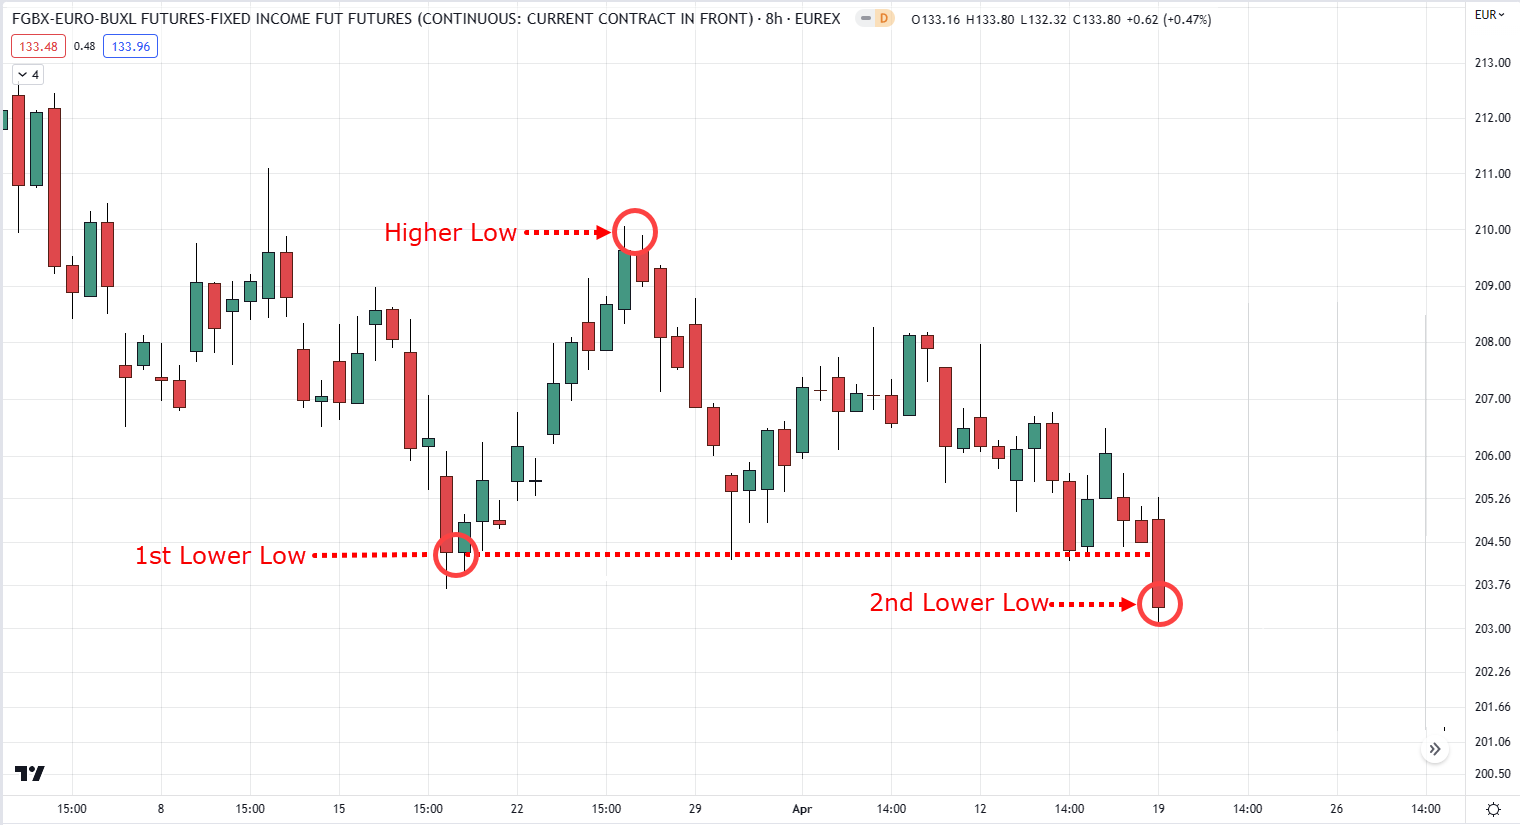
The answer is no because unless the price makes a 2nd lower low, there’s a chance that the price can reverse back and make a false breakout.
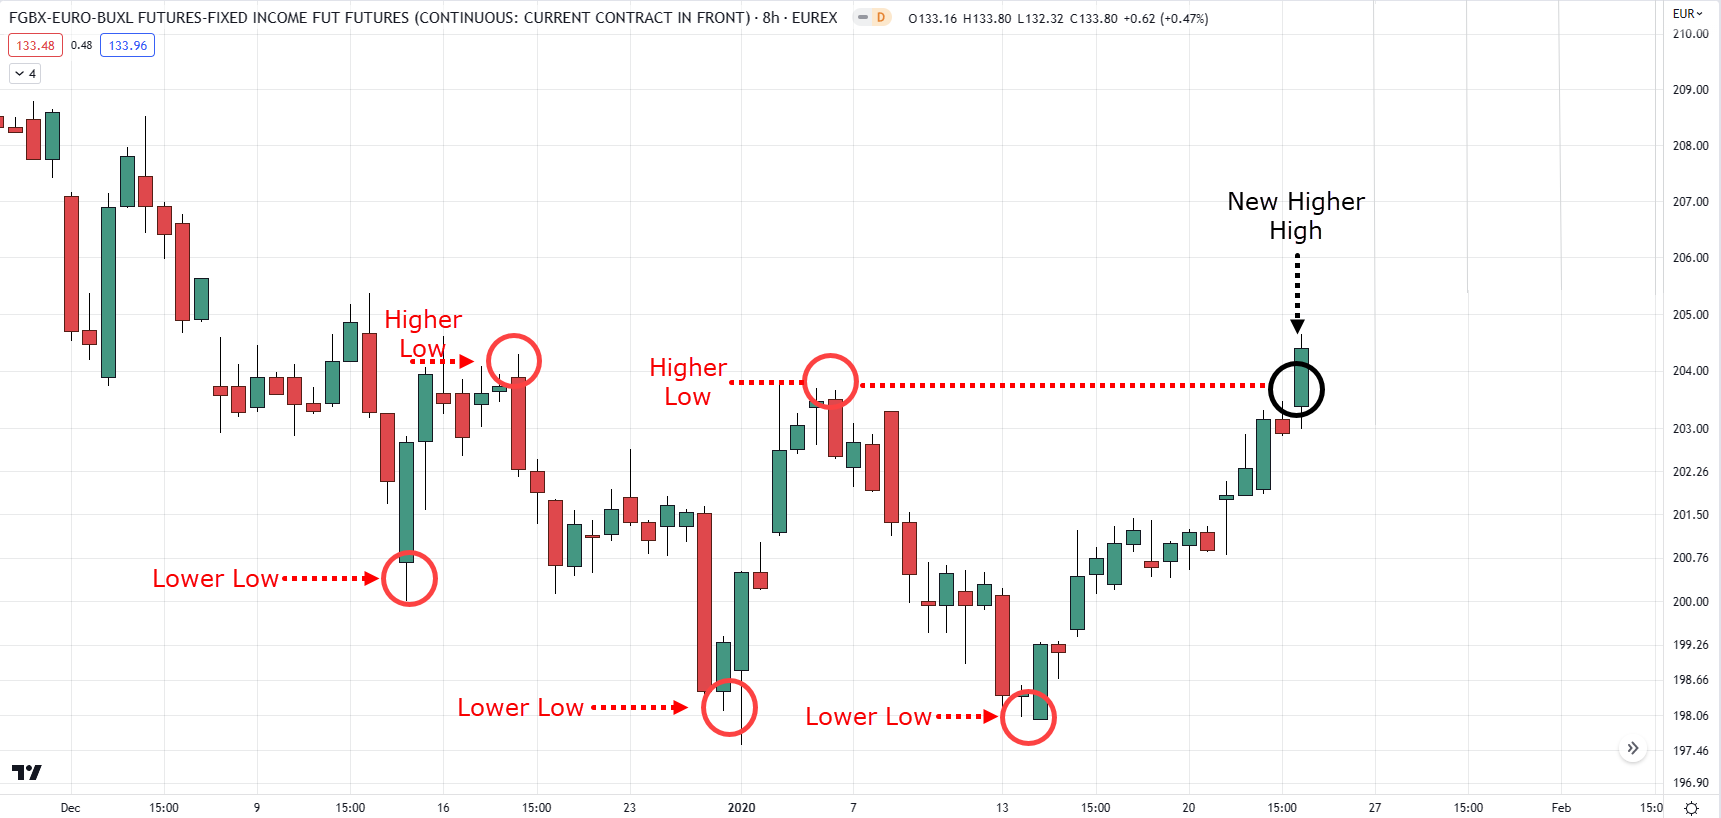
But once it makes a 2nd lower low, it will indicate that the price can potentially head lower…
FGBX-EURO-BUXL 8-hour Timeframe:
On the other hand, a downtrend is invalidated when the price exceeds and closes above the lower high (therefore making a new higher high), which indicates that the price can potentially go higher…
FGBX-EURO-BUXL 8-hour Timeframe:
Last but not least…
Range
Recall:
A range is when the price is stuck in between the highs and lows.
But the truth is that many things can happen “between” those highs and lows.
That’s why a range market can come in various forms, which we call chart patterns.
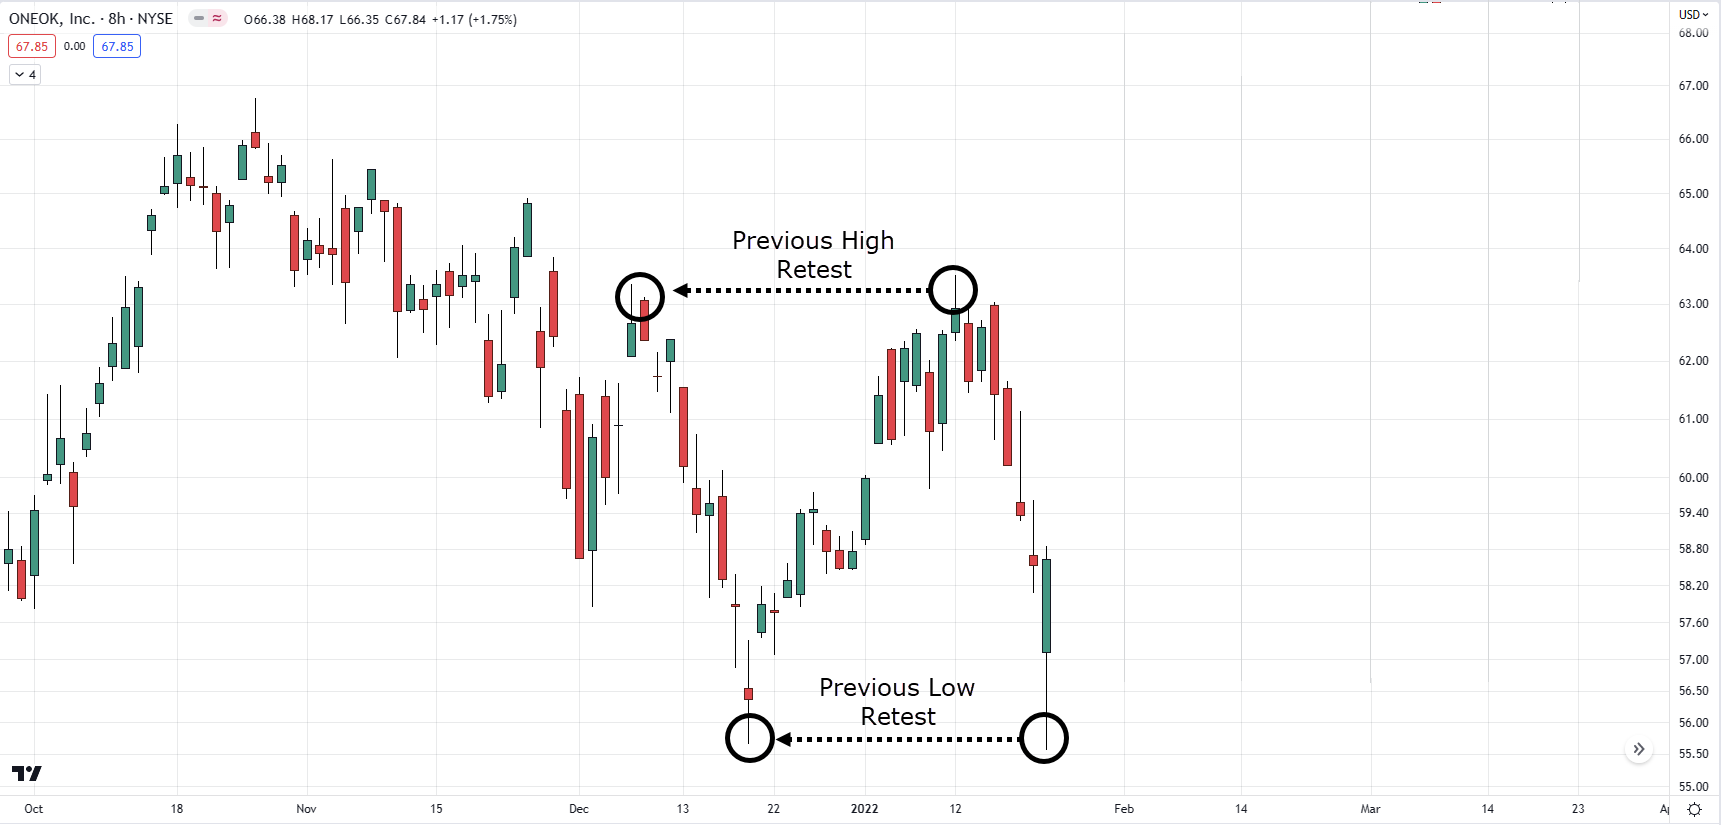
Nonetheless, a range can be considered valid if it retests the previous high and low once (and vice-versa)…
ONEOK, Inc 8-hour Timeframe:
So, when is a range invalidated?
It’s similar to how we confirm trends when it makes a 2nd higher high to confirm a new trend, for example…
Brent Crude Oil 4-hour Timeframe:
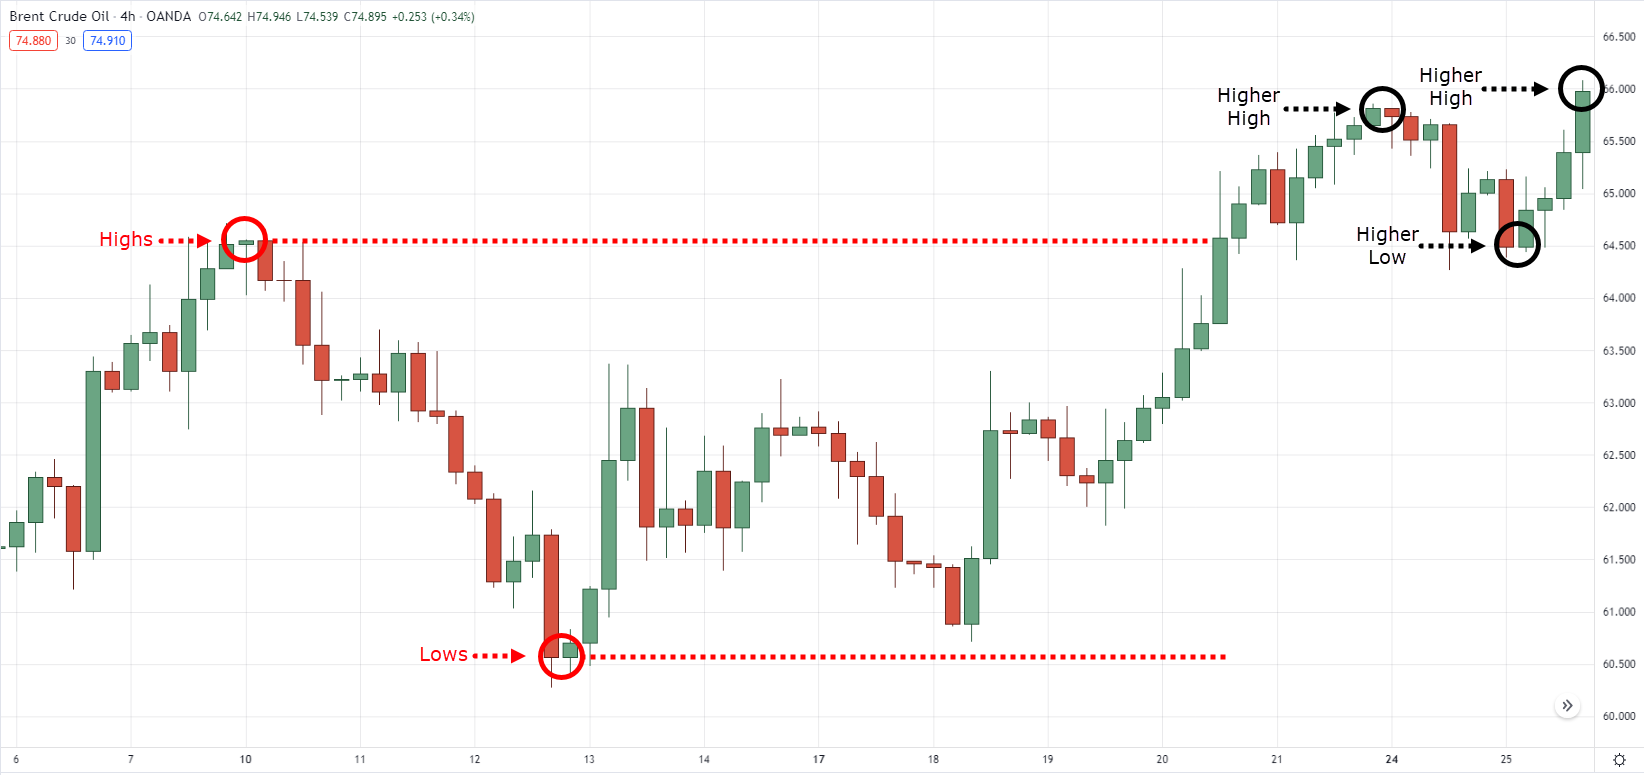
You might be thinking why a range isn’t invalidated when it makes a new higher high.
It can quickly go back to its range and become a false breakout and become the range’s new “high.”
At this point…
I’m sure you’ll notice by now that everything you’ve learned in the first and second sections compliments each other.
That’s why to top it all off…
I will share with you a price action trading strategy that works by using everything you’ve learned so far.
Find out in the next section…
A Simple Price Action Trading Strategy That Works in Any Market Conditions
Many traders think that it’s a “strategy” if it tells you how to enter the markets.
However, that couldn’t be further from the truth…
Because not only do you need to know how to enter the markets, you also need to know when you’ll exit when you’re right and when you’ll exit when you’re wrong!
That’s why in this strategy, we will use a simple yet effective framework called the T.A.E.E. framework.
Which stands for:
- Trend
- Area of value
- Entries
- Exits
Maybe you’ve already heard of this framework before, but I’ll put this in context with everything you’ve learned so far on how to read price action.
Trend
Looking at the example below, you can see that CADJPY on the daily timeframe is in a valid uptrend as it makes its 2nd higher-high:
It means that you want to look for long setups to take advantage of this market.
Now that you have confirmed which type of trend it is, where exactly do you enter?
Area of value
Since we are looking for the “area of value,” you’d want to wait for the price to go down and retest the previous higher high…
US 100 Cash CFD Daily Timeframe:
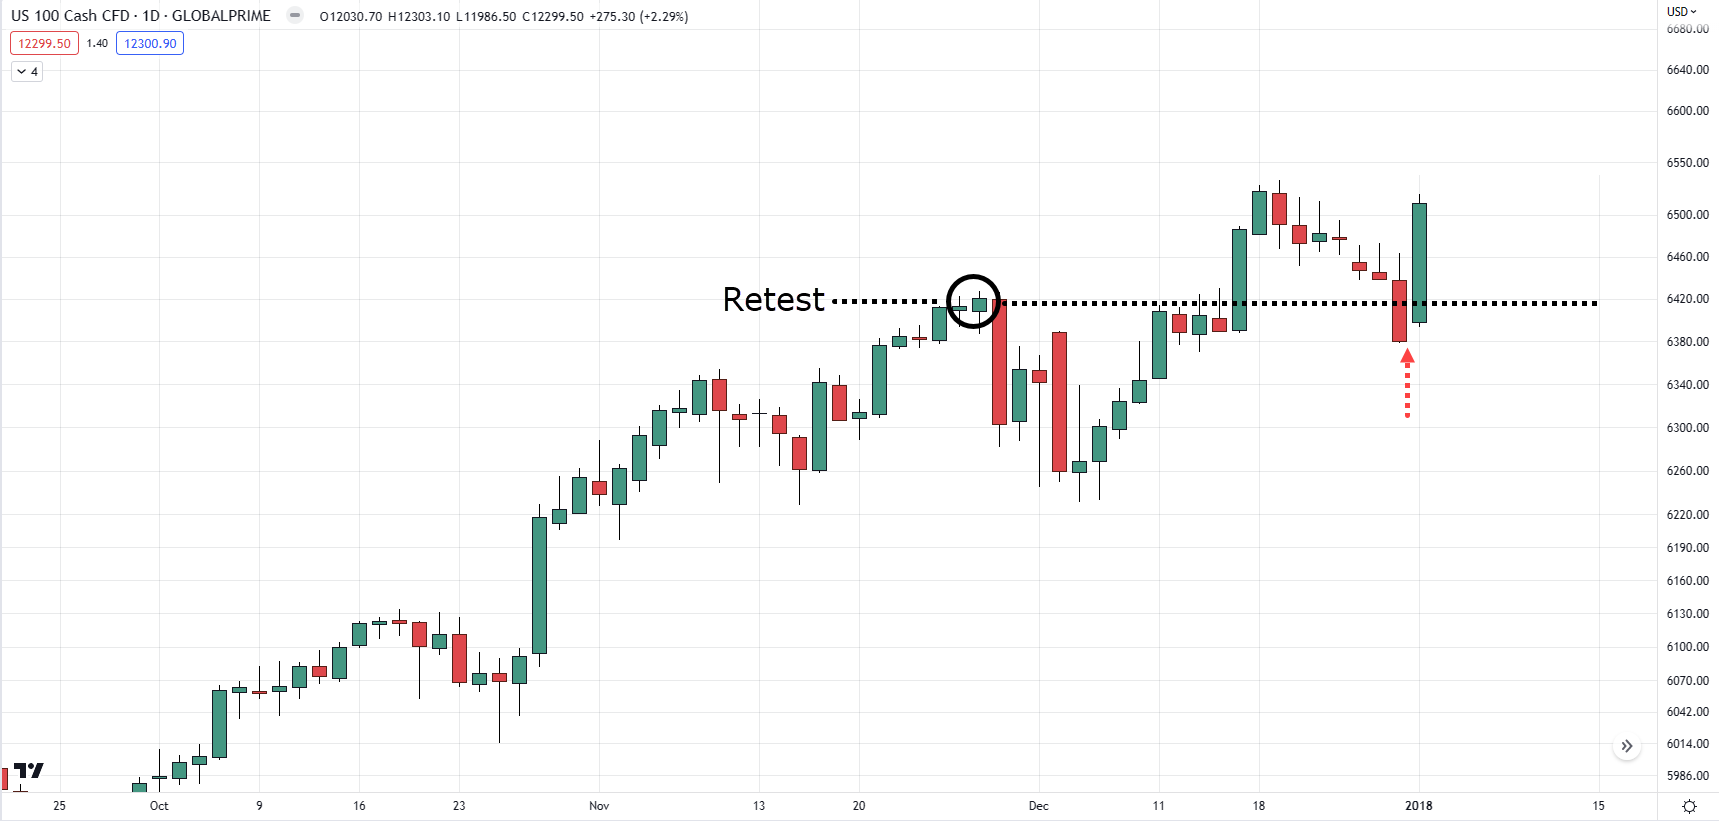
In this case, we’d be looking to buy low and attempt to sell high in an existing uptrend.
Pretty cool, right?
But we’re not done yet.
The next question would be:
“How can I enter this trade?”
Entries
Of course, you do have the option to place an automatic buy limit order.
However, you’d want to see a strong candlestick rejection to avoid this from happening…
US 100 Cash Daily Timeframe:
I’m sure there are many candlesticks to learn, but the truth is you only need to focus on how large the body of a candle is relative to previous candlesticks.
Here’s an example…
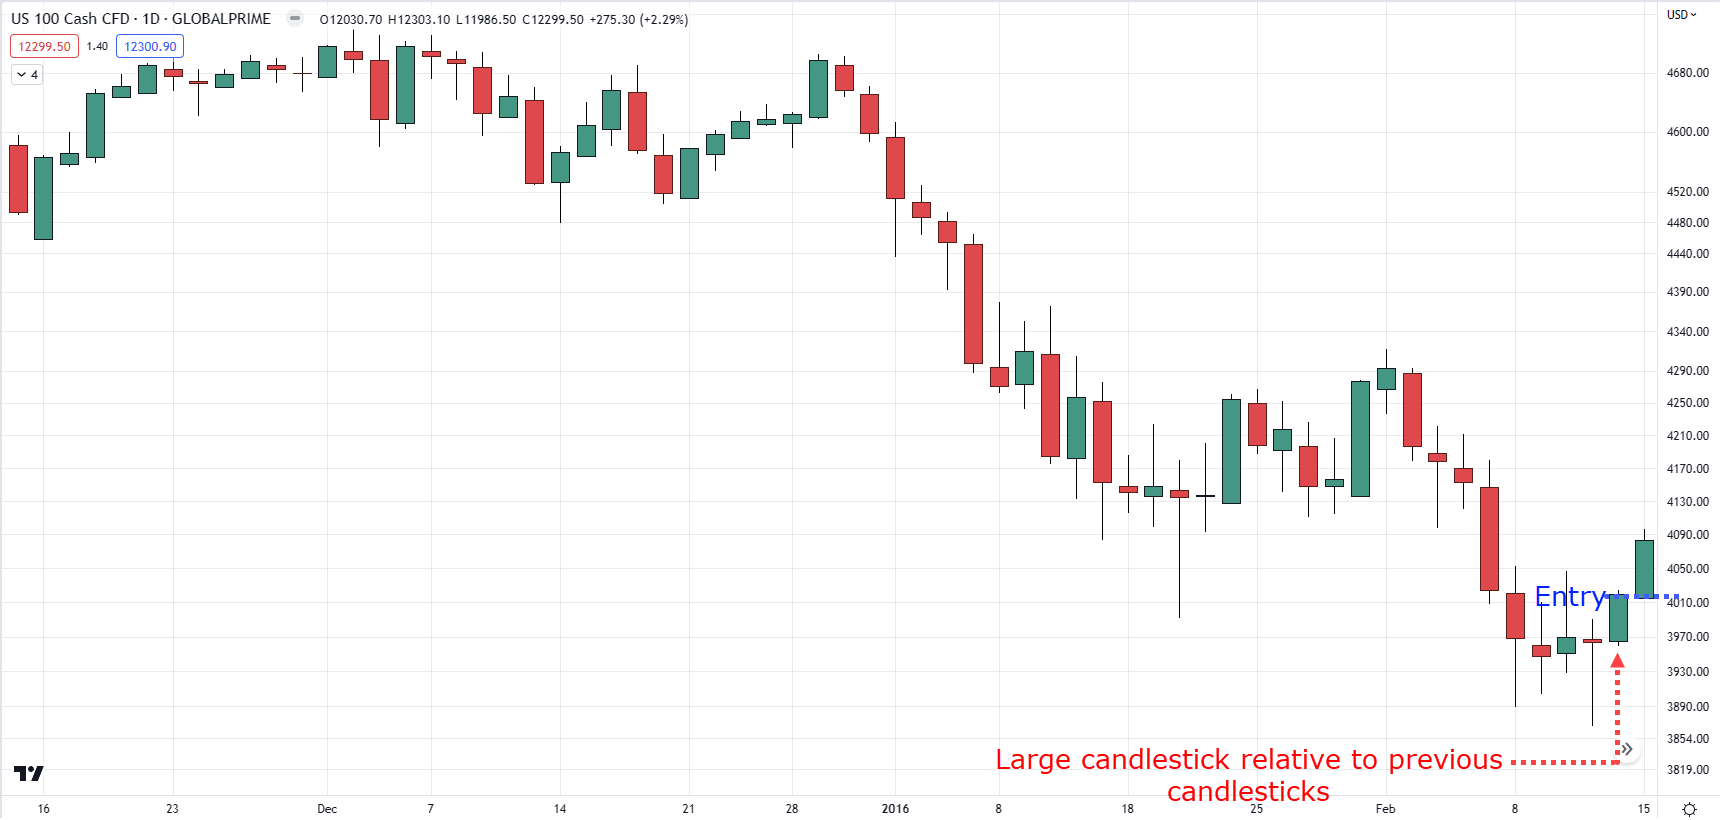
You’re waiting for a candlestick with a large body as a confirmation to enter the trade.
So going back to our example, your entry trigger would be here…
US 100 Cash CFD Daily Timeframe:
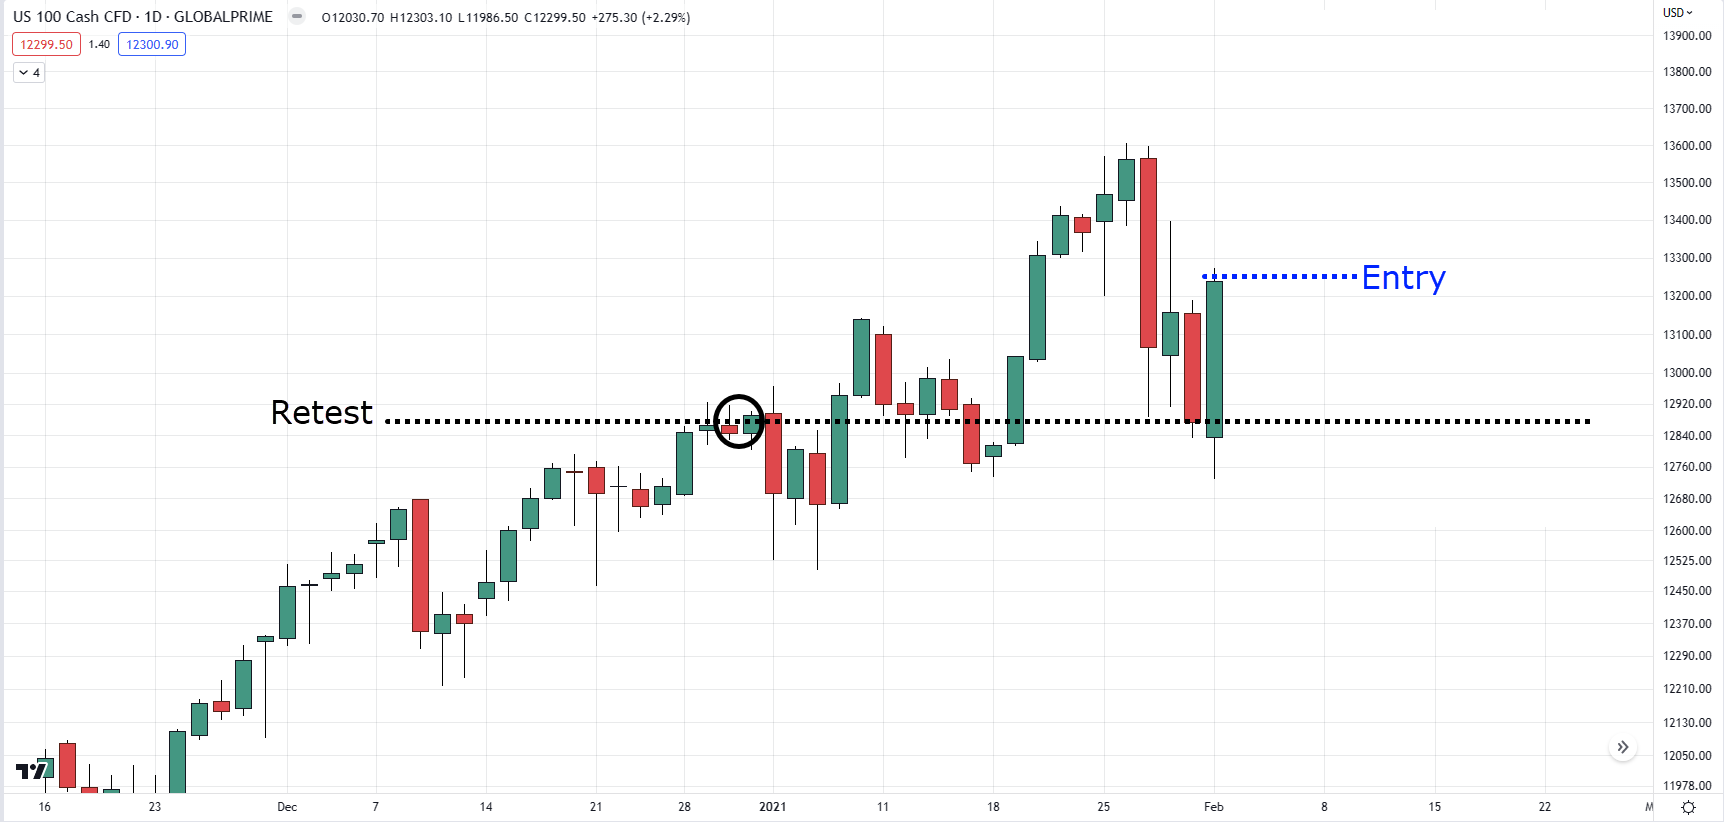
Finally…
Where would you take profits if things go right and cut your losses when things go wrong?
Exits
The most reasonable place to set your take profits is before selling pressure kicks in, which is usually before the previous high…
US 100 Cash CFD Daily Timeframe:
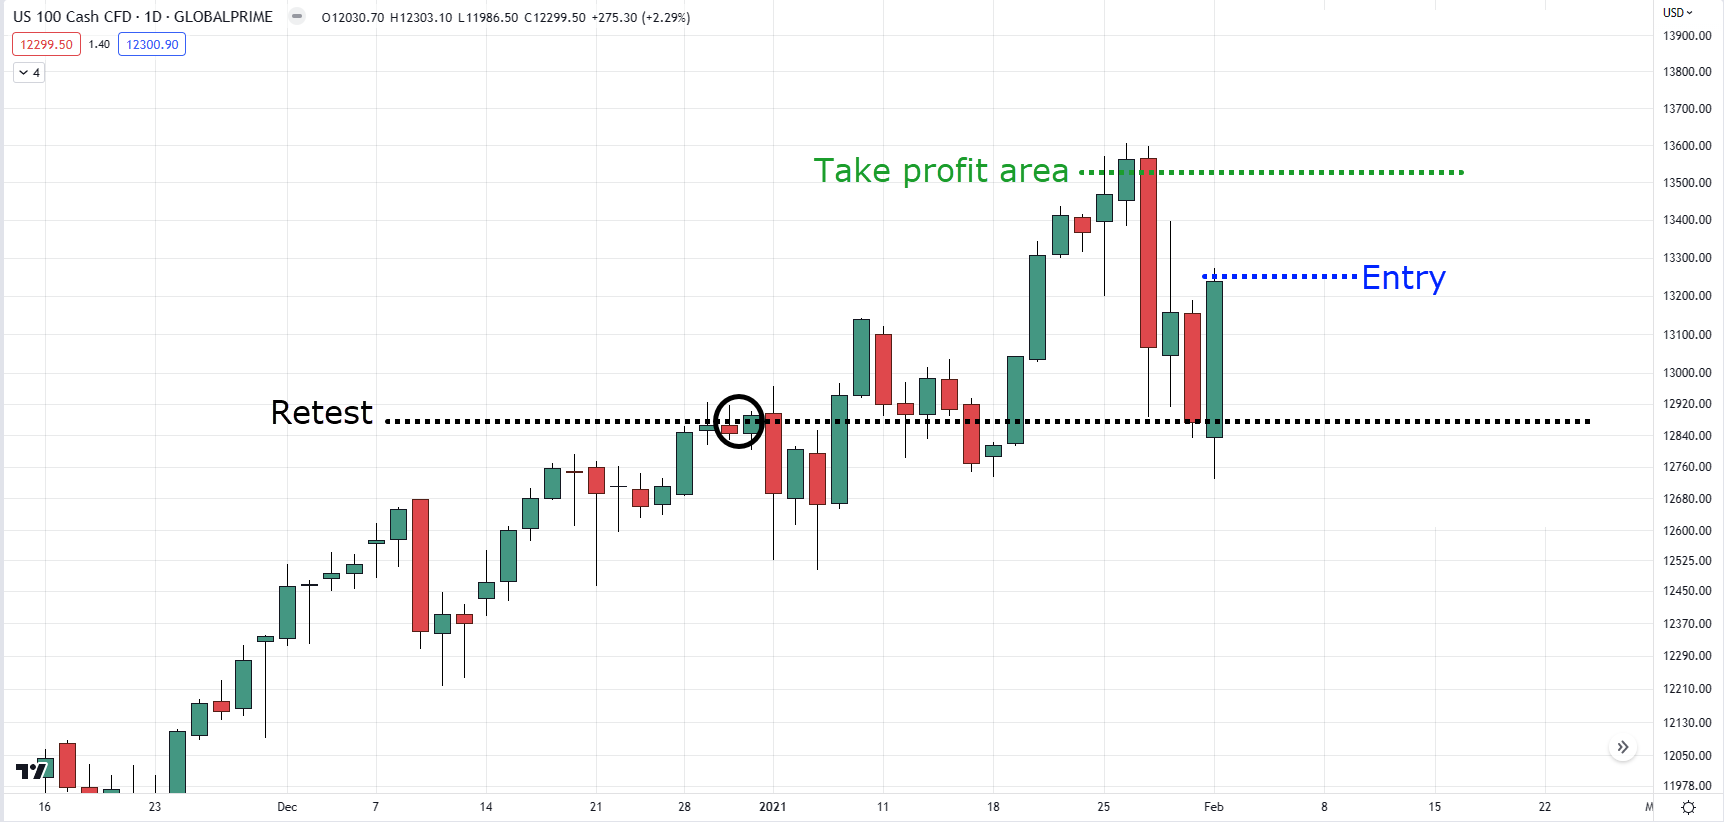
Because if you set your targets too high, there’s a high chance the market will smell your take profit and start going against you.
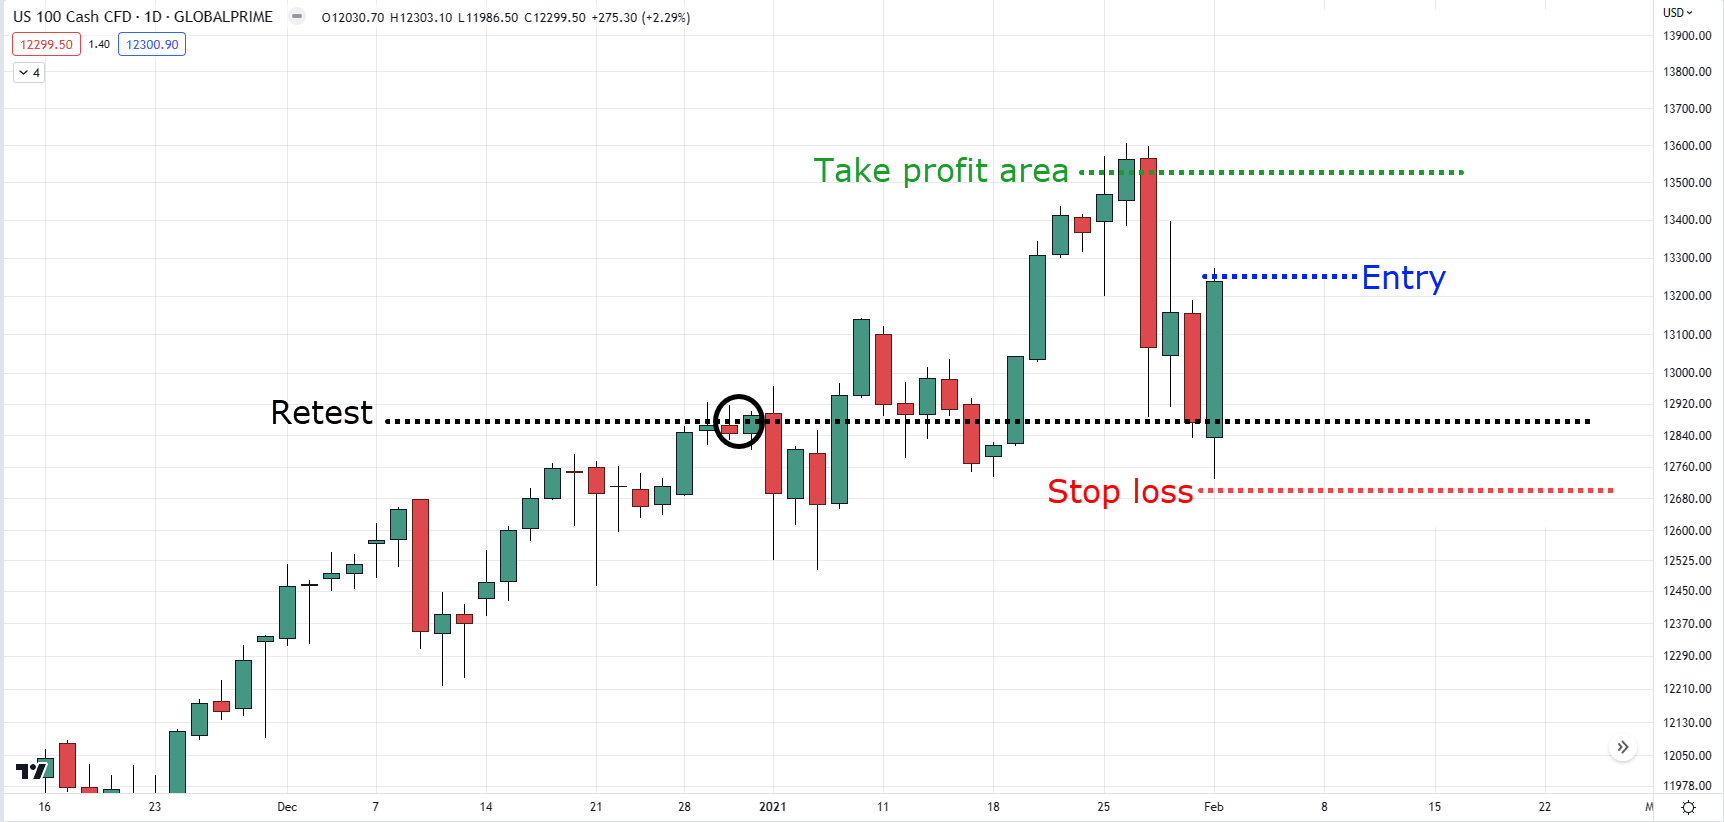
At the same time, you’ll want to give room when setting your stop loss to avoid being stopped out prematurely…
US 100 Cash CFD Daily Timeframe:
That’s pretty much it!
But of course, I’m not going to leave you hanging.
So I’m going to share how to apply this strategy both in ranging and downtrend markets…
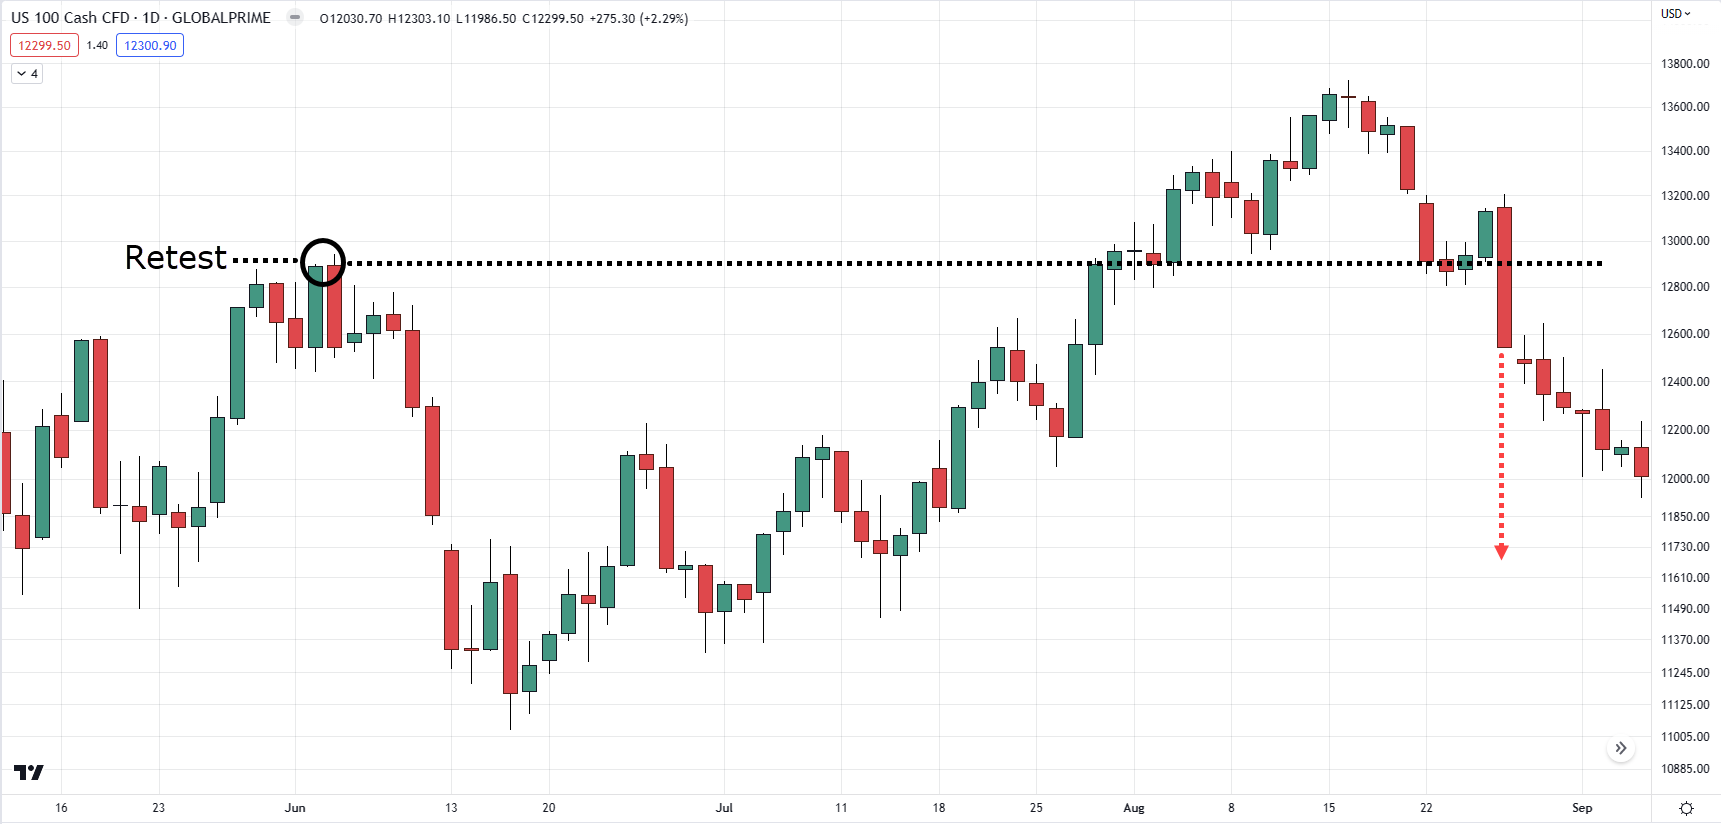
Downtrend: US 100 Cash Daily timeframe
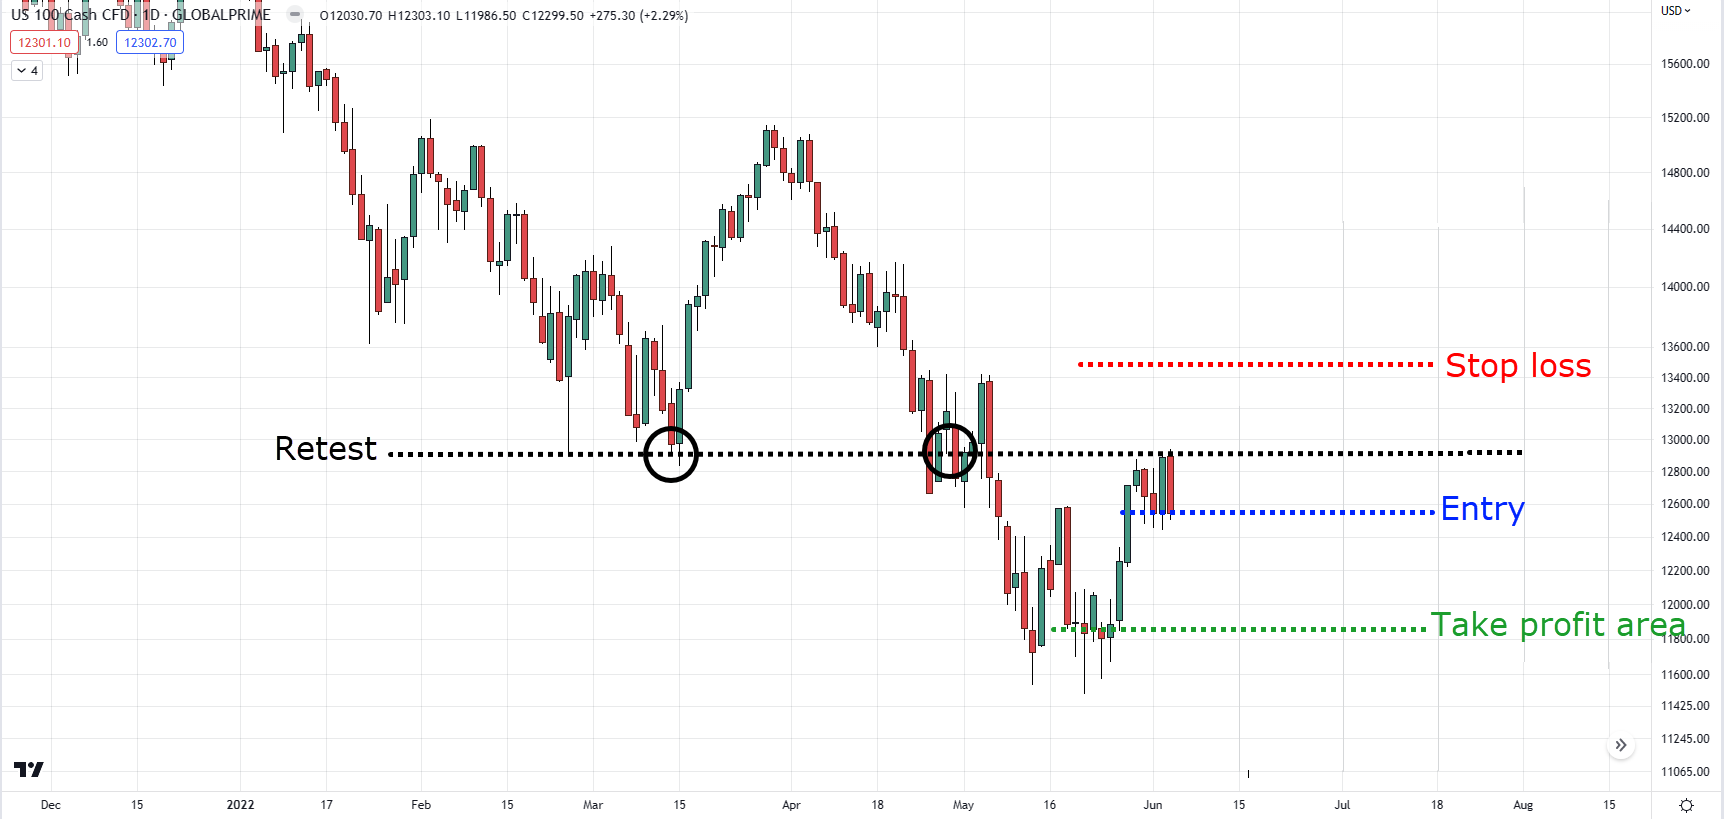
As you can see…
The market is currently in a valid downtrend, this means that you’ll want to look for shorting opportunities.
The market eventually made a retest from the previous lower low and made a valid entry trigger with a strong bearish rejection candle.
Finally, the take profit is set just above the nearest lower low before potential buying pressure kicks in, and stop loss just above the nearest high.
Range: US 100 Cash CFD Daily Timeframe
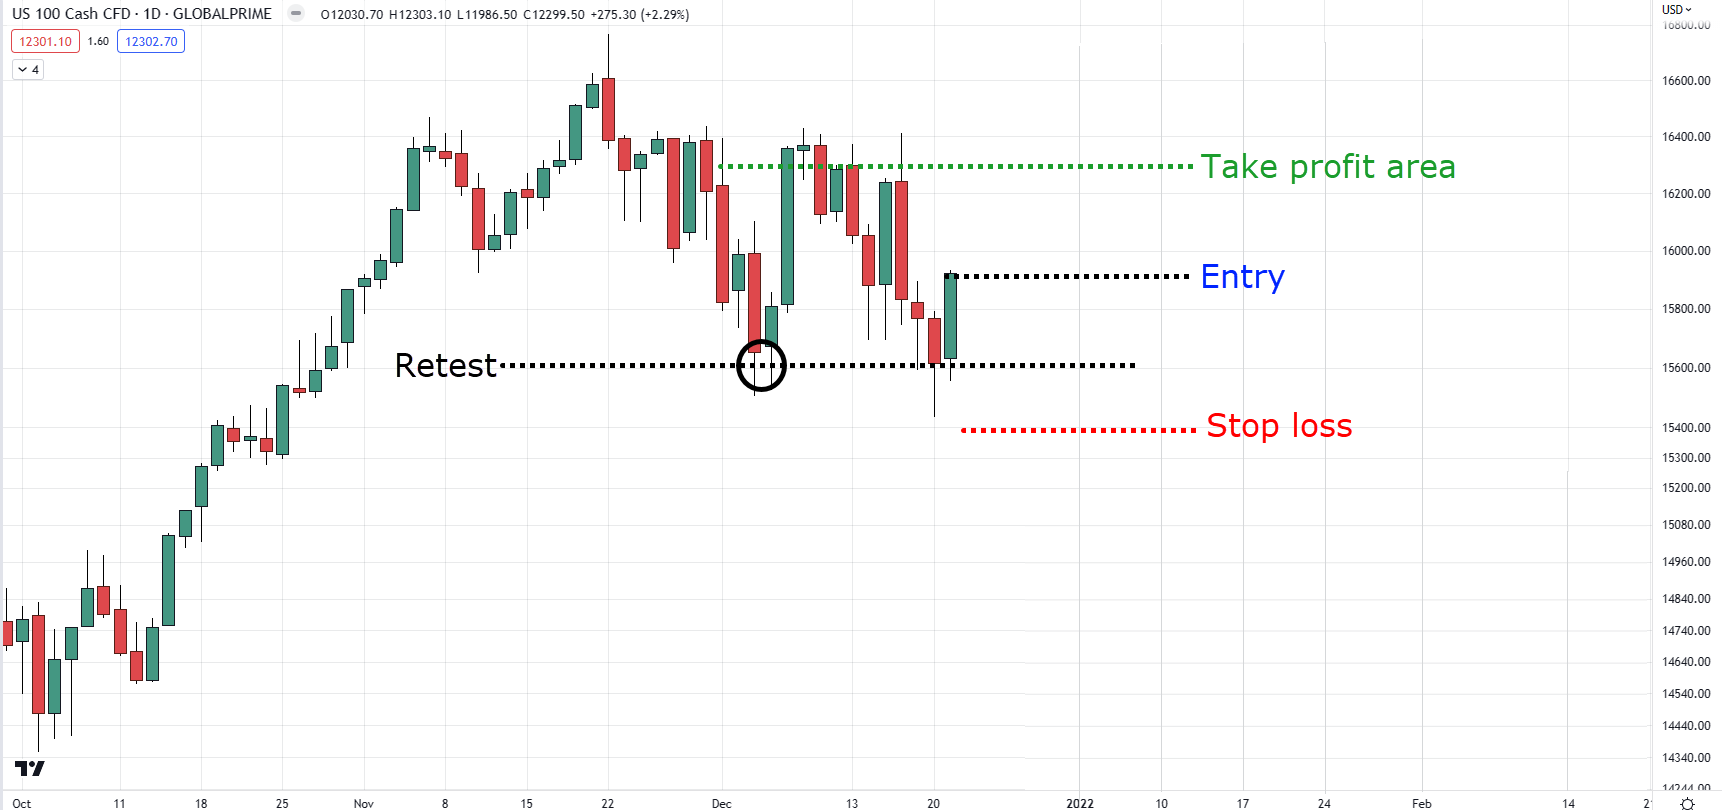
The market is currently in a valid range as the price is contained between the highs and lows.
So, you enter the trade at the retest of the lows with a confirmation of a bullish candlestick.
Finally, you must set your take profits below the previous high and your stop loss below the lows.
Awesome?
With that said, let’s do a quick recap…
Conclusion
Learning how to read price action takes time and practice, and even after you’ve gained the skill of reading price action, there will still be times where the market structure is hard to read.
It’s why you must know when to re-draw your market structures and manage your risk in case a trade doesn’t work out.
So here’s what you’ve learned today:
- The market structure consists of higher highs, higher lows, lower lows, and lower highs.
- An uptrend is valid when the price makes a 2ndhigher high, a downtrend is valid when the price makes a 2nd lower low, and a valid range when the price retests the highs and lows once.
- Using the T.A.E.E. formula and reading the price action gives you many opportunities to trade regardless of market conditions.
Now here’s what I want to know…
What are some tips you could give to a beginner on how to read price action?
Let me know your thoughts in the comments below!