
You’ve probably seen headlines like these…
“Dow plunges 1000 points, erases gain for 2018!”
“Oil heads for seventh weekly loss on signs of global supply glut!”
“Bitcoin crashes, now what?”
And you think to yourself…
Is this a good time to buy?
Well, not so fast.
Because the last thing you want is to catch a falling knife.
Instead, a better approach is to identify the Double Bottom pattern so you can pinpoint market reversals with deadly accuracy.
But first…
What is a Double Bottom Pattern and how does it work?
A Double Bottom Pattern is a bullish trend reversal pattern (and we call the opposite a Double Top).
It has three parts to it:
- First low – first price rejection
- Second low – second price rejection
- Neckline – an area of resistance
Now you’re probably wondering:
“What does a Double Bottom pattern indicate?”
I’ll explain…
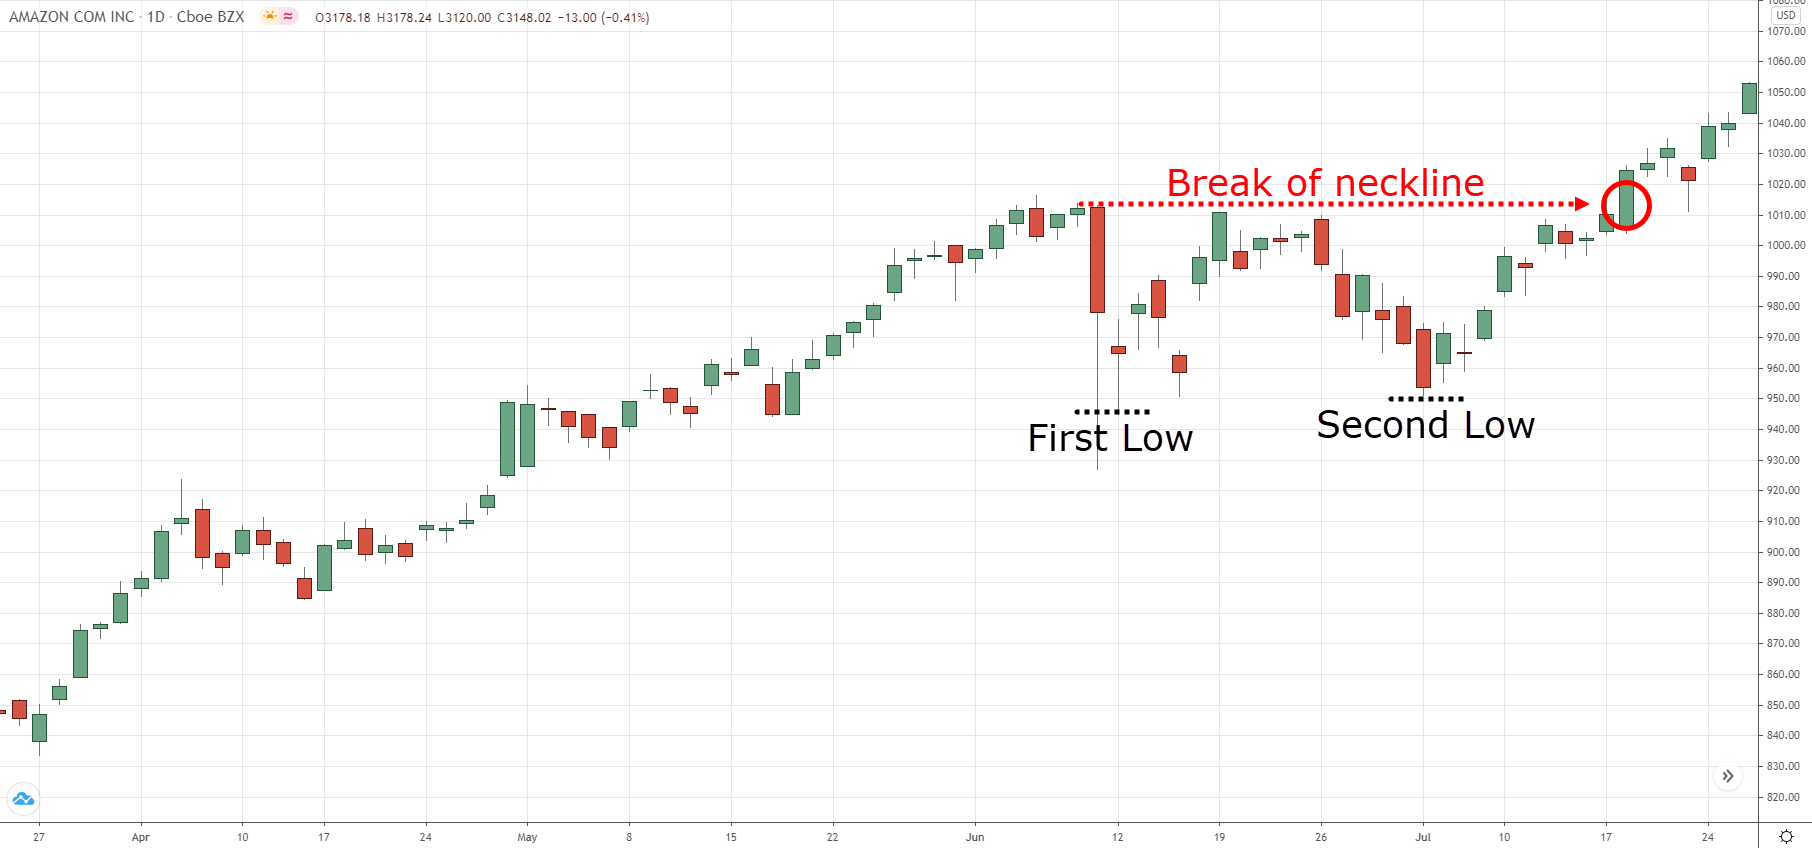
First low – The market bounces higher and forms a swing low. At this point, it’s likely a retracement in a downtrend.
Second low – The market rejects the previous swing low. Now, there’s buying pressure, but it’s too early to tell if the market could continue higher.
Break of neckline – The price broke above the Neckline (or Resistance) and it signals the buyers are in control — the market is likely to move higher.
In short, the Double Bottom Pattern signals the downtrend has possibly bottomed out, and the price is about to move higher.
Here’s what it looks like:
Seems easy, right?
But before you trade the Double Bottom pattern, you want to avoid this common trading mistake…
Don’t make this mistake when trading the Double Bottom pattern…
So what is it?
Well, many traders buy the break of the neckline after a Double Bottom is formed.
But watch out.
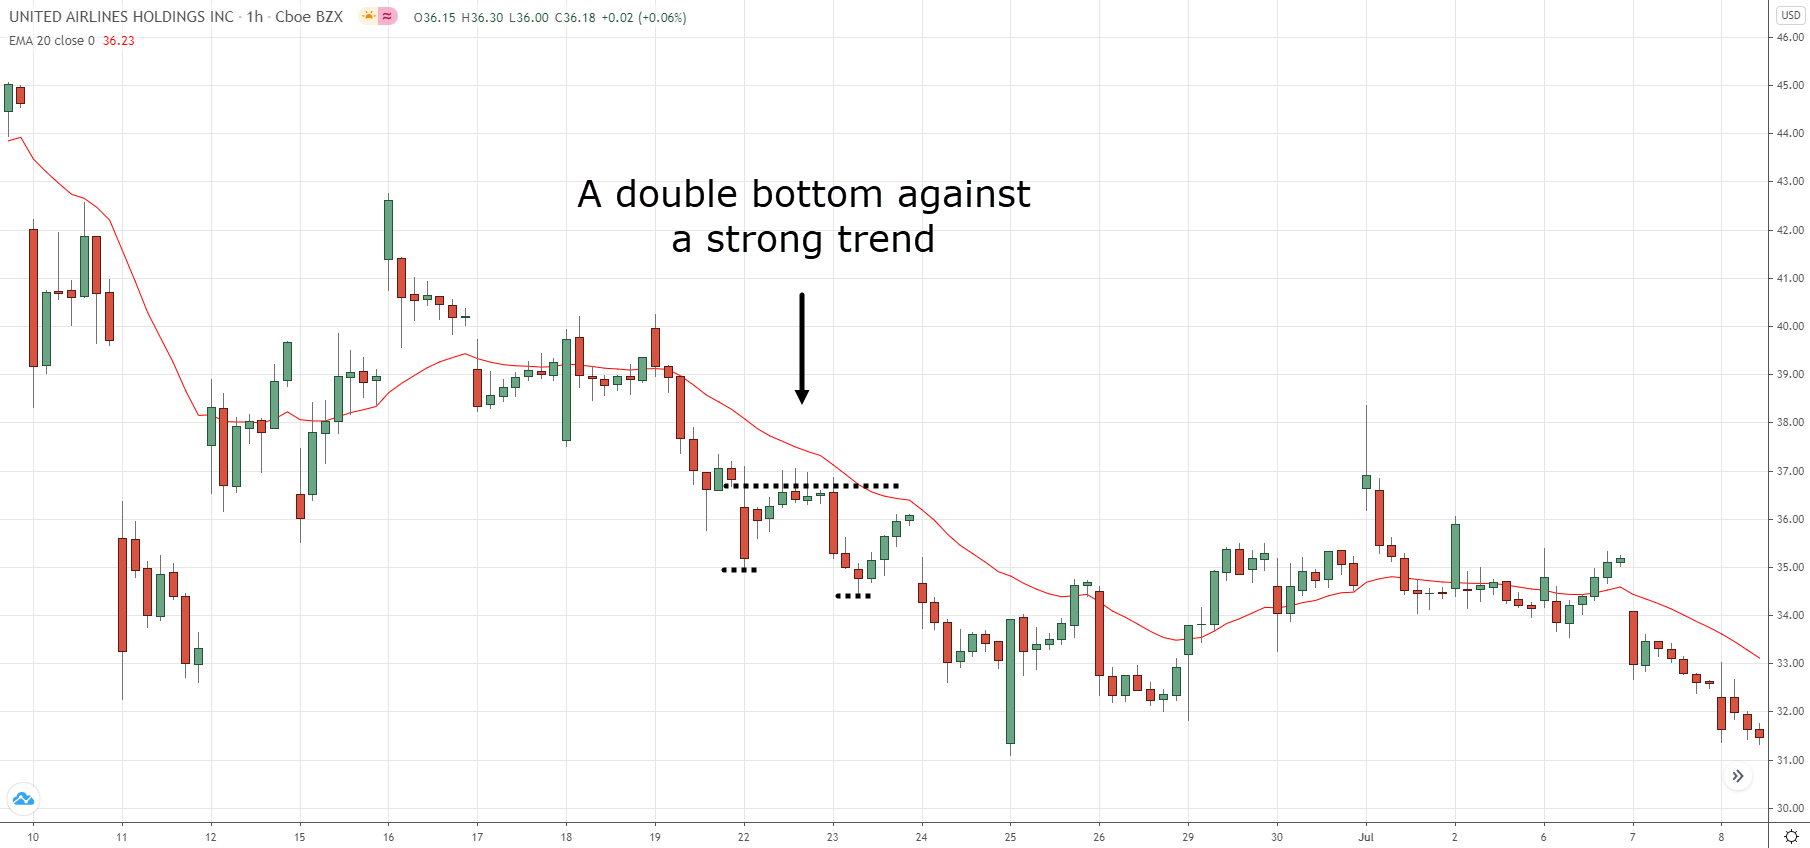
Because if the market is in a strong downtrend and it forms a “small” Double Bottom, then chances are, the market is likely to continue lower.
So how do you avoid it?
Here’s how…
- Add the 20-period Moving Average(MA) to your chart
- If the price is below the 20MA, don’t buy the Double Bottom
Here’s an example:
Now you’re probably wondering…
“Then how do I trade the Double Bottom pattern?”
Well, that’s what I’ll cover next.
Read on…
The False Break: How to trade the Double Bottom Pattern and profit from “trapped” traders
Now…
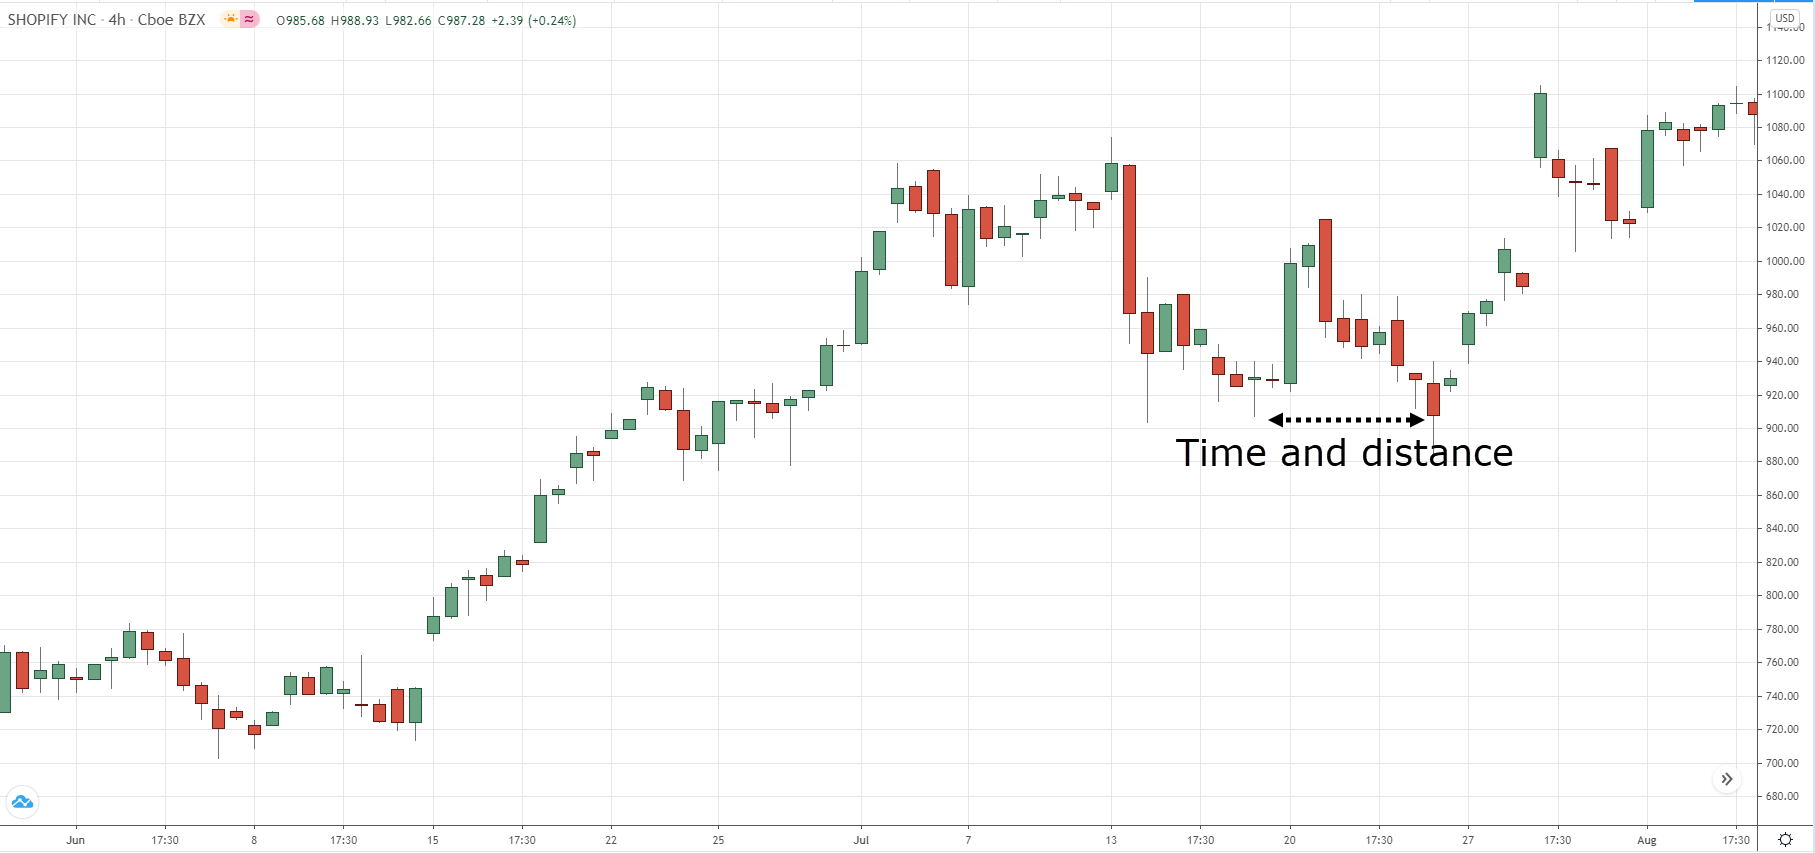
When you trade the Double Bottom, you must pay attention to the time and space between the lows — the larger the “gap”, the better.
Why?
Because when the lows are far apart, it gets the attention of more traders who could push the price higher.
Here’s what I mean…
And with this concept, you can use it to profit from “trapped” traders.
Here’s how…
- The first and second lows should have time and space between them
- Let the price break below the first low
- Wait for a rejection of lower prices and then go long
An example:
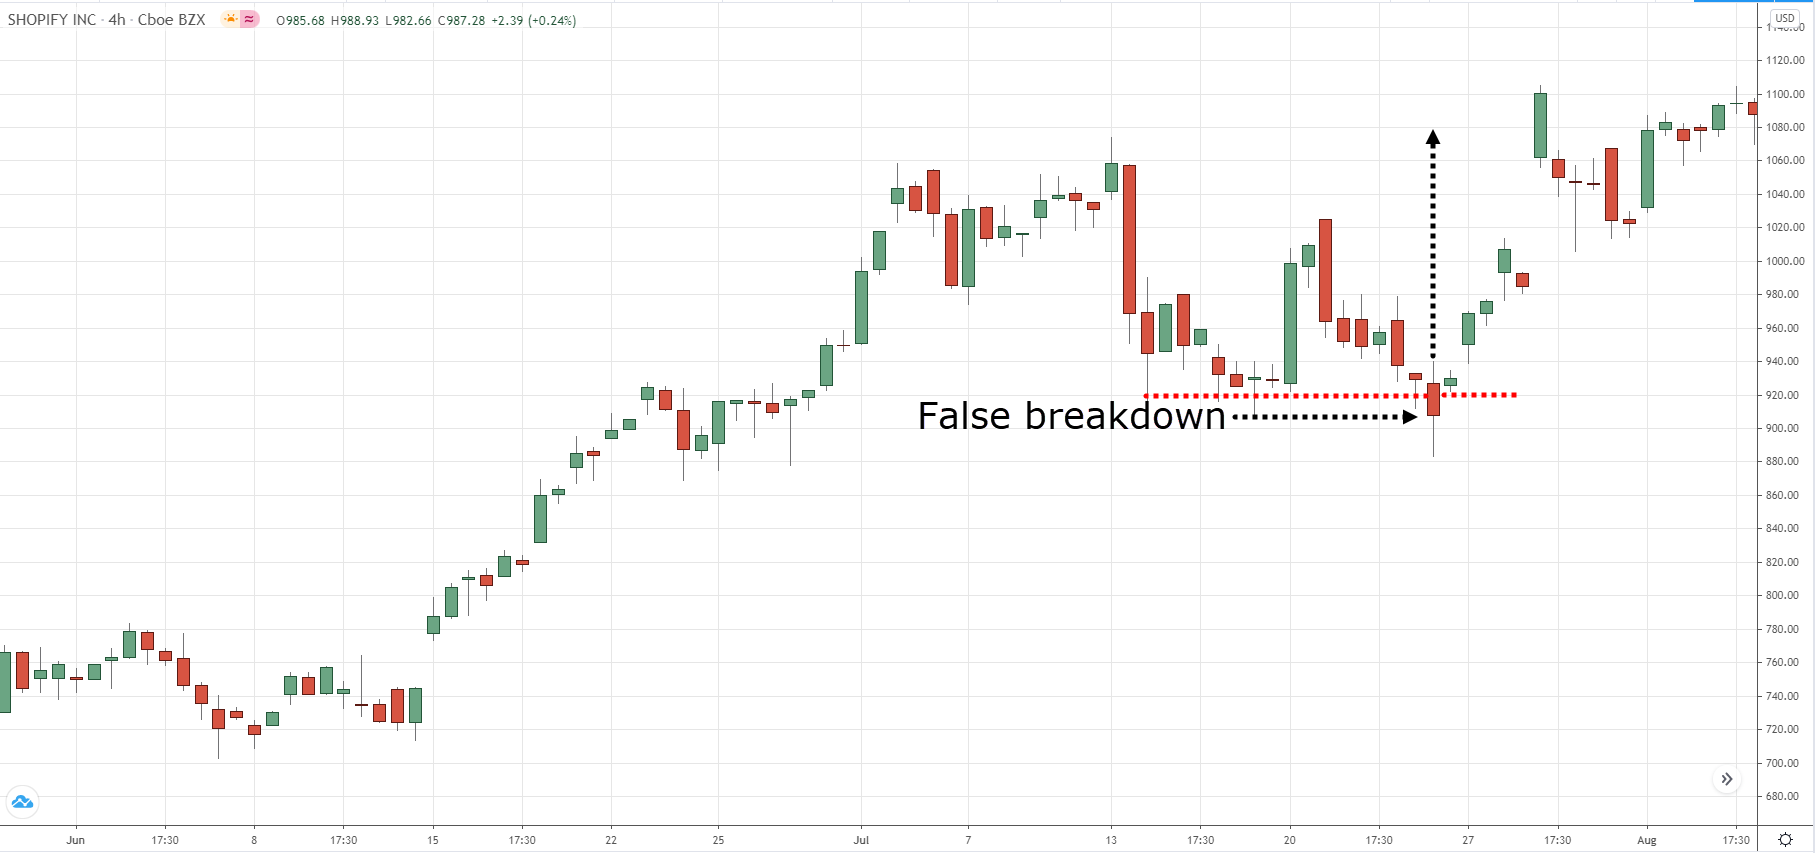
The idea is simple.
As the price breaks below the first low, bearish traders will short the markets and have their stops above the lows.
But if the price quickly reverses higher, the short traders are “trapped”.
And you can take advantage of it by going long, anticipating if the price moves higher, it’ll trigger their stops and push the market in your favor.
Does it make sense?
Great!
Then let’s move on…
The Double Bottom Breakout Technique
Here’s the thing:
You don’t want to “chase” a breakout after the Double Bottom is formed because the price is likely to reverse lower.
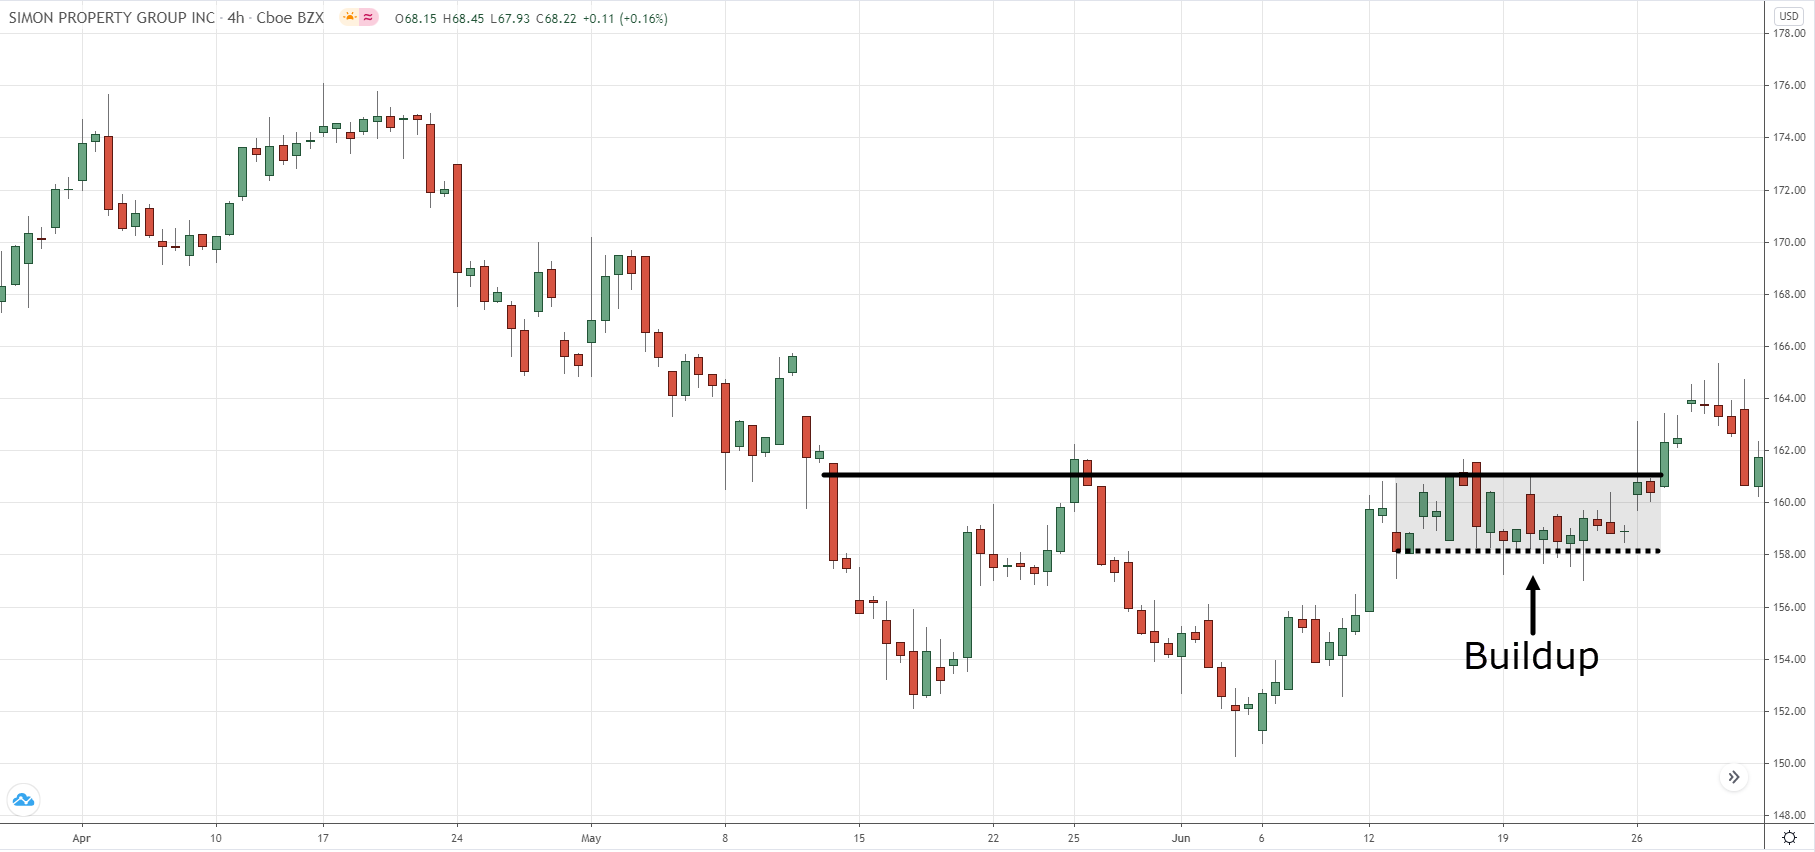
Instead, you want to see strength from the buyers before buying a breakout.
Here’s how…
- Identify a potential Double Bottom
- Let the price to trade break above the previous swing high
- Wait for a weak pullback to form (a series of small range candles)
- Buy on the break of the swing high
Here’s an example:
Now, this is a powerful technique for two reasons…
Higher probability trading setup
You’re not catching a falling knife. Instead, you let the price break above the previous swing high to show strength from the buyers.
Favorable risk to reward
When there’s a weak pullback, it tells you there’s a lack of selling pressure. Also, you can set your stop loss below the swing low which offers a better risk to reward.
Now you might be wondering…
“But what if there’s no pullback, and the price makes a sudden breakout without warning?”
Well, that’s what I’ll cover next.
Read on…
Don’t chase the markets, do this instead…
Now:
If the price makes a sudden breakout, the last thing you want to do is “chase” the market.
Why?
Because you don’t have a logical place to set your stop loss, and you’ll likely get stopped out on the pullback or reversal.
So, what can you do?
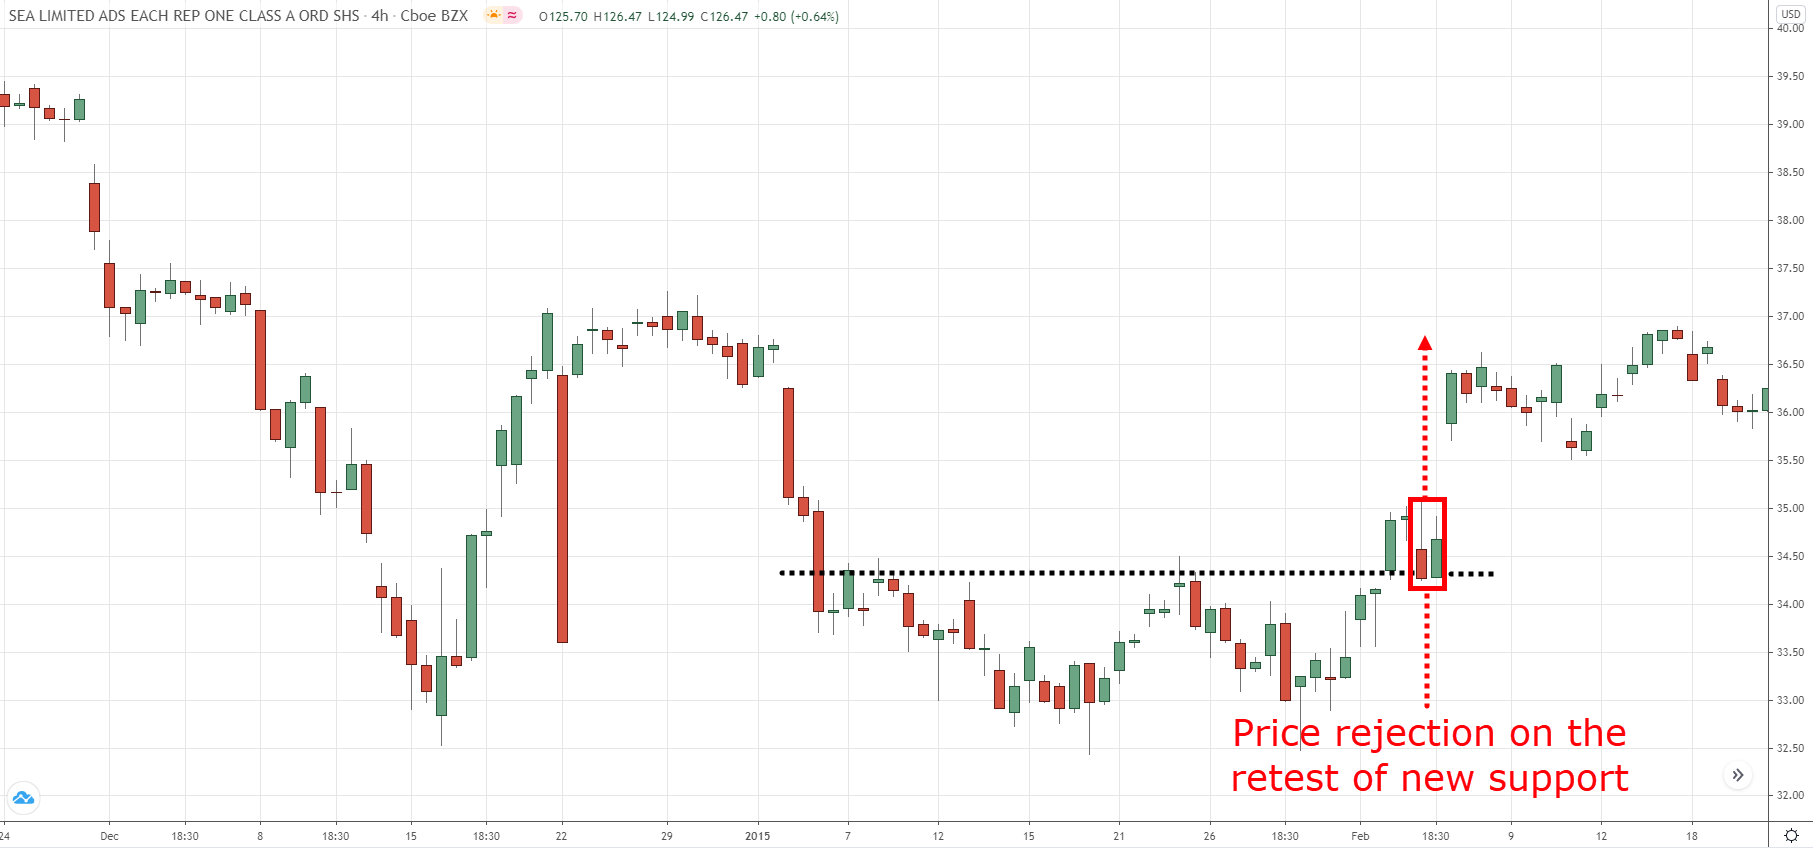
You wait for the re-test of the breakout level.
Here’s how…
- If the price makes a sudden breakout, wait for it to re-test previous Resistance turned Support
- If there’s a re-test, wait for a bullish reversal candlestick pattern to form
- If there’s a bullish reversal candlestick pattern, go long on the next candle with stops 1 ATR below the low
Here’s what I mean…
Pro Tip:
Sometimes, the market might not re-test the level you’re looking at.
Instead, it’ll form a Bull Flag chart pattern (which is another setup you can trade).
If that happens, you can go long when the price breaks above the Bull Flag and have your stops 1 ATR below it.
How to pinpoint Double Bottom reversals with deadly accuracy
Here’s the deal:
Not all Double Bottom are created equal.
You can have two identical Double Bottom pattern, but one has a high probability of reversal, and the other is likely to fail.
So now the question is, how do you filter for the high probability pattern?
Well, the answer is…
Multiple Timeframes.
Here’s how it works…
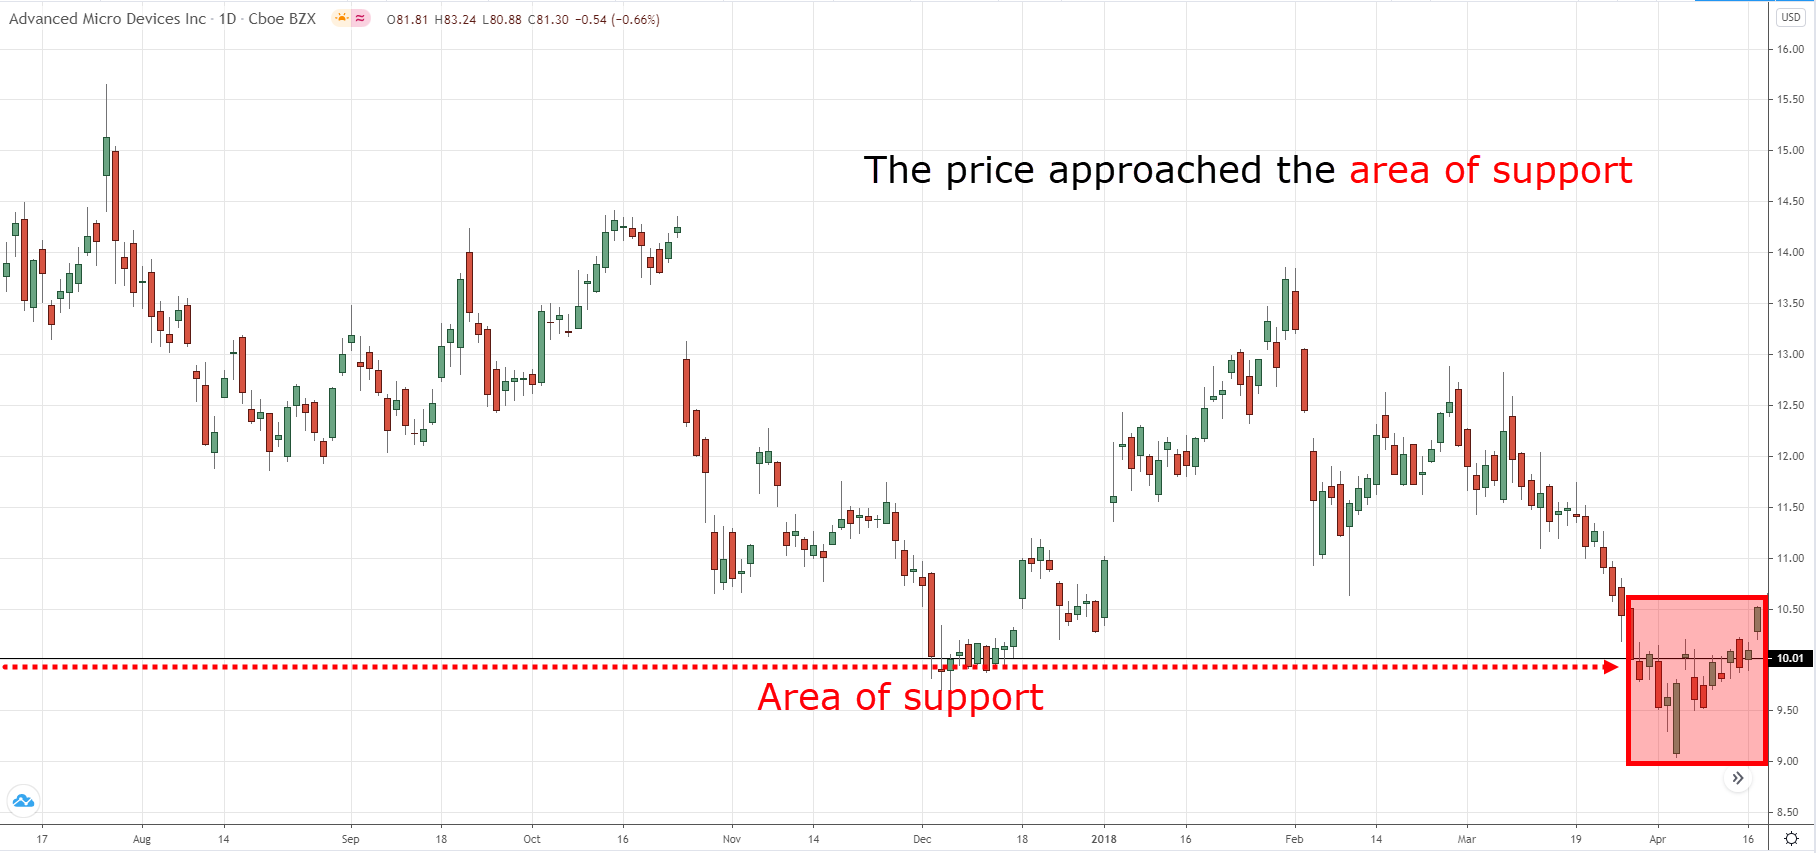
- Identify a higher timeframe Support area
- Go down to a lower timeframe and look for a Double Bottom pattern that leans against the higher timeframe Support
Here’s an example:
On the higher timeframe, the price is at Support area…
On the lower timeframe, you get a Double Bottom pattern…
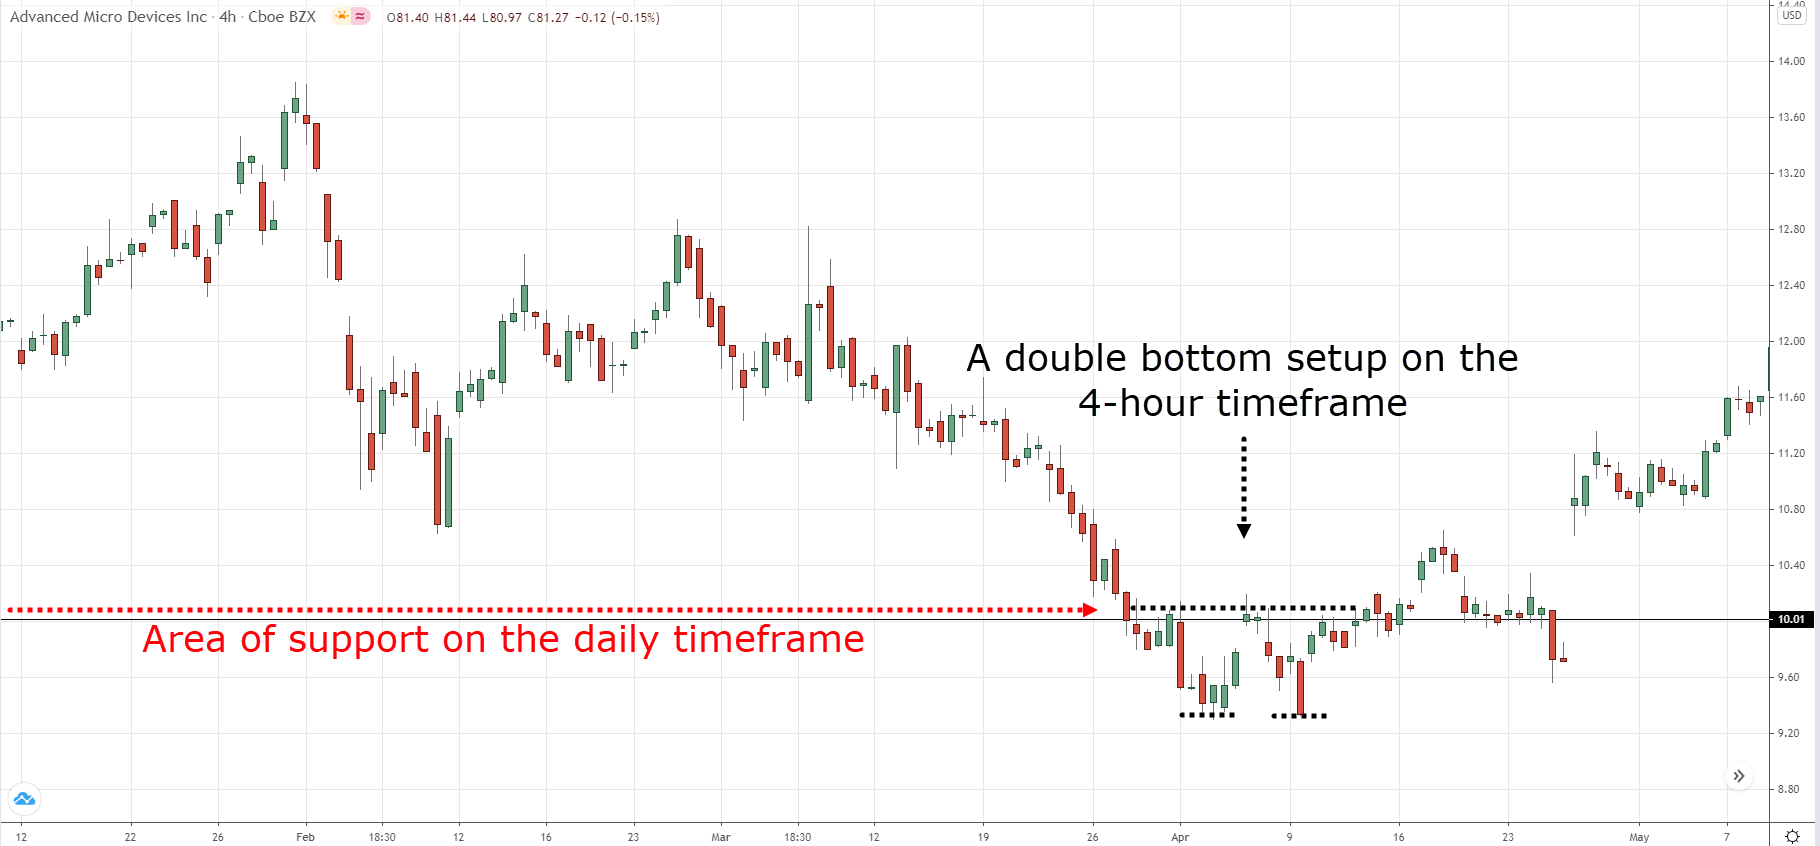
Now…
You can combine this multiple timeframe analysis with the entry techniques you’ve learned earlier — you’ll realize your reversal trades will dramatically improve.
This is powerful stuff, right?
Conclusion
So here’s what you’ve learned today:
- The Double Bottom signals the downtrend has possibly bottomed out and the price could possibly move higher
- Don’t buy a Double Bottom in a strong downtrend (when the price is below 20MA)
- You can use the False Break technique to profit from “trapped” traders
- If you want to trade the Double Bottom Breakout, wait for a buildup to form at the neckline so you have a favorable risk to reward
- You can use multiple timeframes to improve the accuracy of your reversal trades
Now, it’s your turn to share…
How do you trade the Double Bottom Pattern?
Leave a comment below and share your thoughts with me.
This is very informative stuff in nutshell you have ; getting this one can have an edge in their trading career thanx bro
Glad to hear that, you’re welcome!
Great content! Keep up the good work!
Thank you, more to come!
Very good trading materials you have provided for your subscribers and it is free. I have learned a lot from it. Thank you very much Rayner! Sincerely appreciate it. May God bless you and your family 🙂
You’re welcome, Michael!
Such a great awareness, what nobody tell us. Hats off to you
Thank you for the kind words, Biplab!
Great post as usual, question regarding breakouts, after a breakout do you always wait for a retest? Many times I was for the re-test of resistance and miss out on a big move upwards.
Hey there Travis, no, we always find a way how to trade breakouts whether there is a retest or not.
Don’t limit yourself to always waiting for a retest!
If it comes, trade it, if it doesn’t then wait for a breakout of the pullback!
Is a powerful tools, thanks Rayner
You’re weldome, Henry!
Thanks bro for your educational resources. It helps us alot who are dreaming become pro profitable fx traders. Blessings 🙌
Very happy to hear that Nyakoojo, you’re welcome!
Wow… Nice one. I trade mine after a retest back to the neckline and wait for a candle stick reversal confirmation.
Awesome, let me know how it goes in the long run!
Thanks for the informative piece. You talked about space between the bottoms, approximately how much space is good space? Like how many candles between the bottoms?
Hey there Johse, it’s not very accurate to put exact numbers between the bottoms
Because double bottoms come in different shapes and sizes, some double bottoms form within 50 bars, some double bottoms form within 200 bars
So instead of looking for a specific “value” look for a specific “visual”
Is it clear to your eyes that it’s a double-bottom pattern? then it most likely is
Are you having a hard time figuring out that it’s a double-bottom pattern that you’re squinting your eyes? then it most likely isn’t
Great Learning
Definitely, Shiv!
You didn’t say anything about taking profits
Hey there Henry, you can consider taking your profits at the nearest swing high/low!
Thank you very much for sharing knowledge with us
God bless you
You’re welcome Sachidananda!
Thank you for guiding us.I will apply this method in trading routine.
You’re welcome, Mian!
Thanks so much for your help sir this is really helpful as a beginner what broker is the best sir ?
Sir according to your first picture, the double bottom occurred in an up trend. So how advisable is it to trade double bottom in an up trend market?
Do you mean how to trade the double bottom in a downtrend?
If so, then count the candles.
If the double bottom has a lot more candlesticks than the downtrend, then there’s a high chance it could reverse.
But if the downtrend has 3x more candles than the double bottom, then it’s going to get crushed!
So much value for free, it’s amazing.
Only the best for you, Prefa!
M big fan of u, I watched almost all your YouTube video u r really great teacher
Appreciate the kind words Ayen, thank you!
When a double bottom pattern is formed in a down trend on the daily timeframe, I go down to the 4hr timeframe to find higher higher approaching resistance ( Ascending triangle) to trade the breakout of resistance on the 4hr timeframe.
Sounds good, Mohammed!!
Patiently following so far so good
Great to hear that, Tsepang!
It all about analysis 🙌 and to be sure you know what you are doing
Great, thanks for sharing, Emmanuel!
Hey Rey.bthis is wonderful I get a good technique here. Thanks alõt
You’re welcome, Cheborgei!
Glad you liked it!