
The 200 day moving average (MA) is one of the most followed indicators.
Just tune in to financial news and you’ll hear stuff like…
“The S&P has broken below the 200 day moving average — it’s a bear market!”
“You should buy when the price cross above the 200 day moving average.”
“Apple just closed below the 200MA — time to sell.”
But here’s the thing:
How does it help you as a trader?
It doesn’t.
Instead, it toys on your emotion and causes you to buy/sell at the wrong time.
But don’t worry, we’re going to change all that.
Because in today’s post, you’ll discover…
- What is the 200 day moving average and how does it work
- How to use the 200MA and increase your winning rate
- How to better time your entries when trading with the 200MA
- How to ride massive trends without getting stopped out on the retracement
- How to identify the correct market cycle so you don’t get caught on the wrong side of the move
Sounds good?
Let’s get started now….
What is the 200 day moving average and how does it work?
The Moving Average (MA) is a trading indicator that averages the price data, and it appears as a line on your chart.
Here’s how it works…
Let’s assume over the last 5 days, Apple shares closed at 100, 90, 95, 105, and 100.
So, the 5-period MA is [100 + 90 + 95+ 105 +100] / 5 = 98
And when you “string” together these 5-period MA values together, you get a smooth line on your chart.
Now the concept is the same for the 200 day moving average.
The only difference is you look at the last 200 days of price data which gives you a longer-term moving average.
Here’s how to plot 200 day moving average (on TradingView):
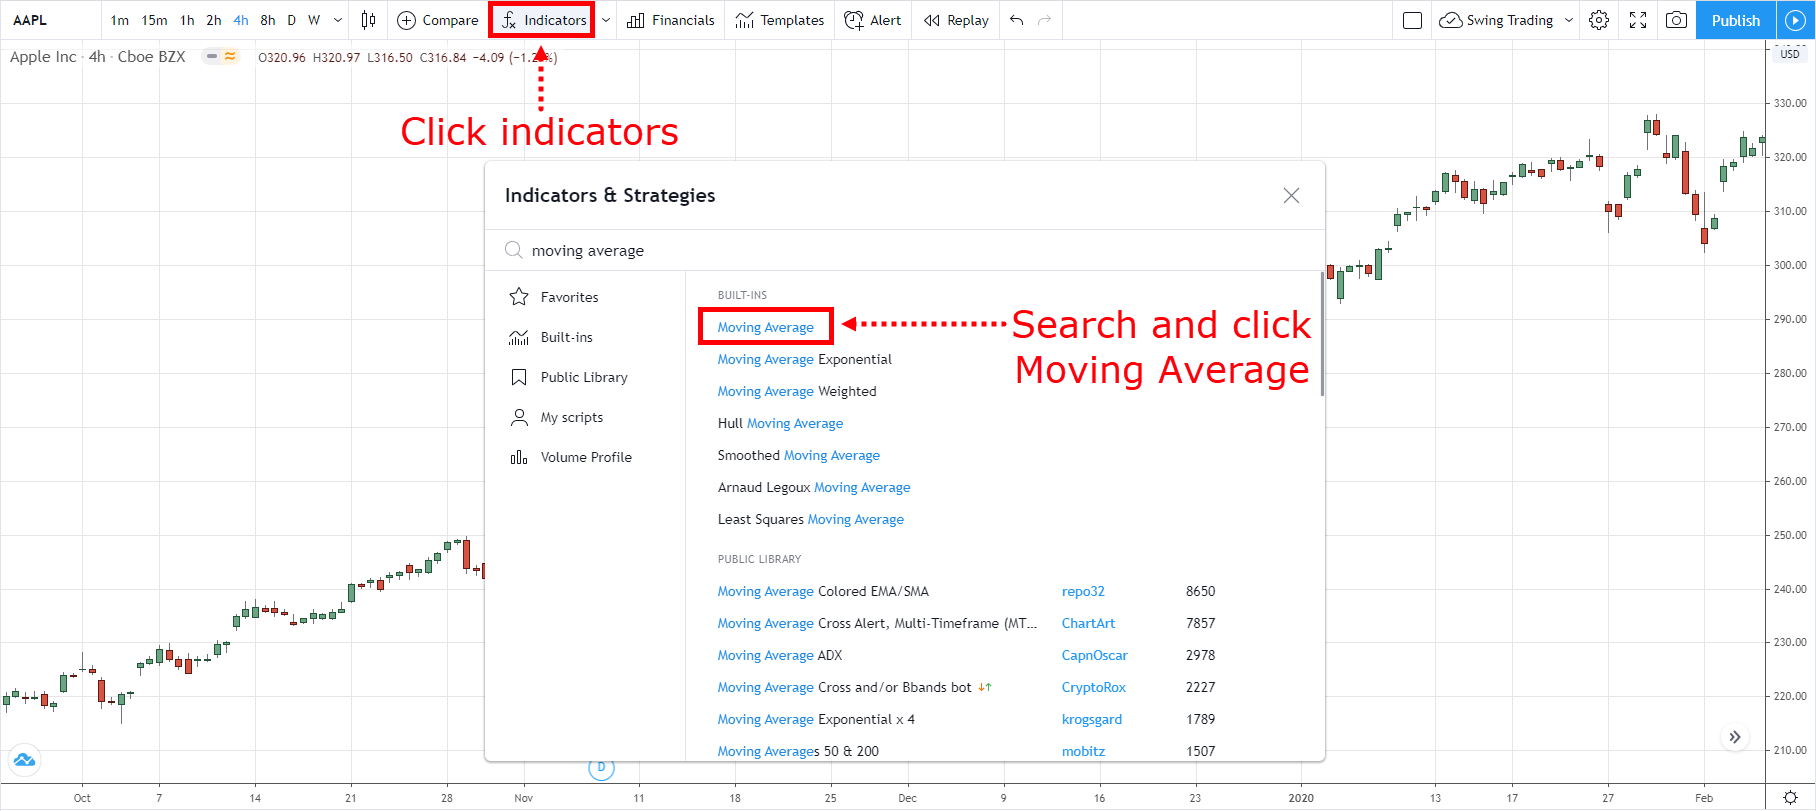
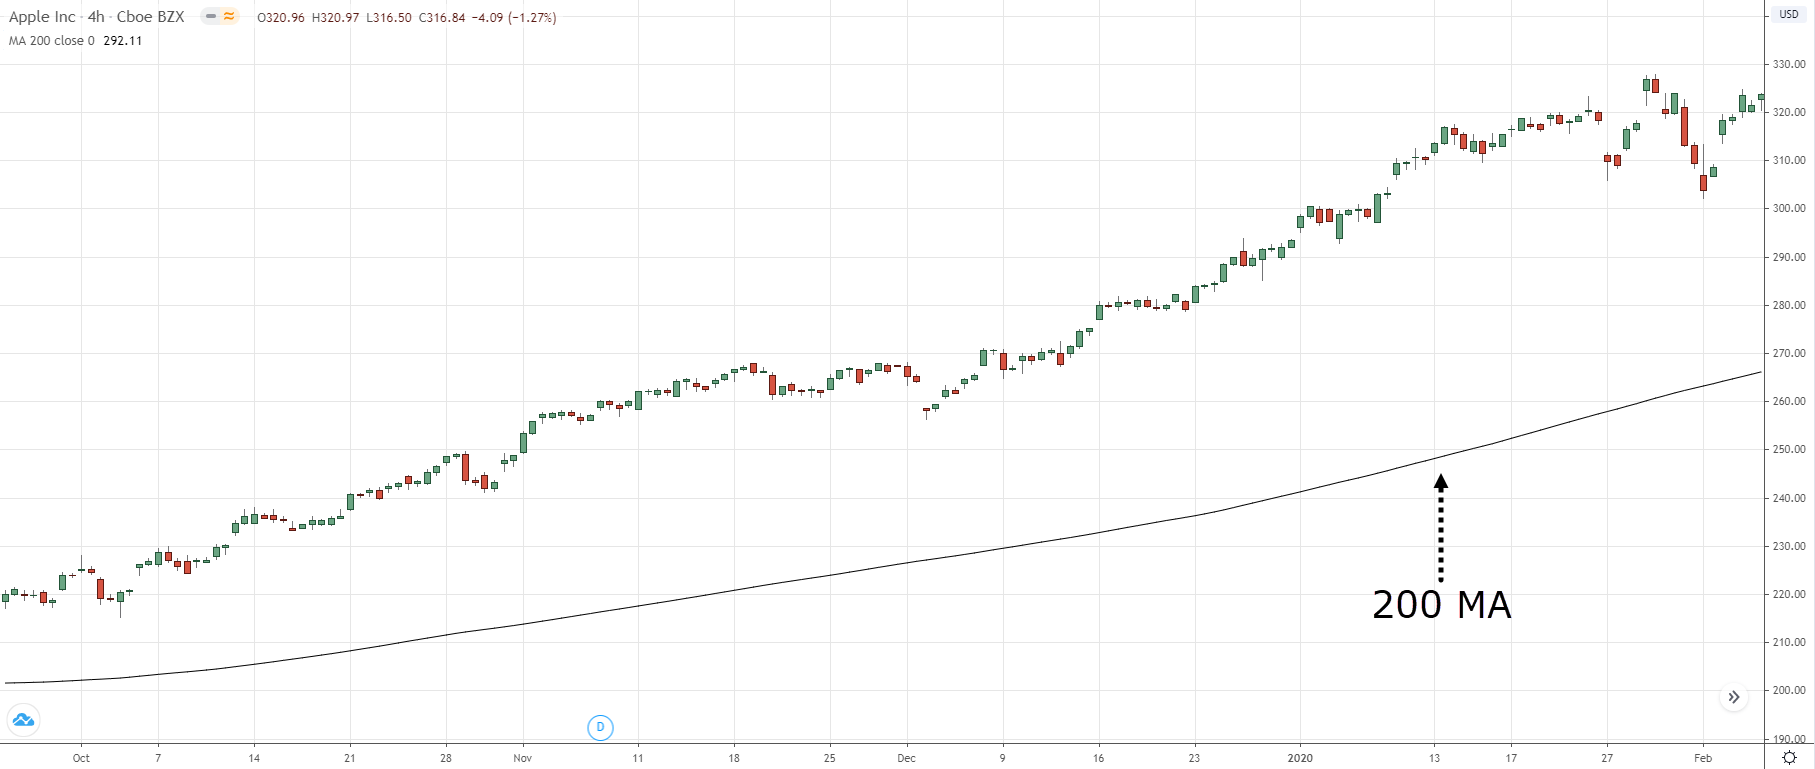
And here’s how it looks like: A 200 day moving average chart
Now, there are different types of moving averages like exponential, simple, weighted, etc.
But you don’t have to worry about it because the concept is the same (only the way it’s calculated is slightly different).
Let’s move on…
How to use the 200 day moving average and increase your winning rate
Here’s the thing:
The 200 day moving average is a long-term indicator.
This means you can use it to identify and trade with the long-term trend.
Here’s how…
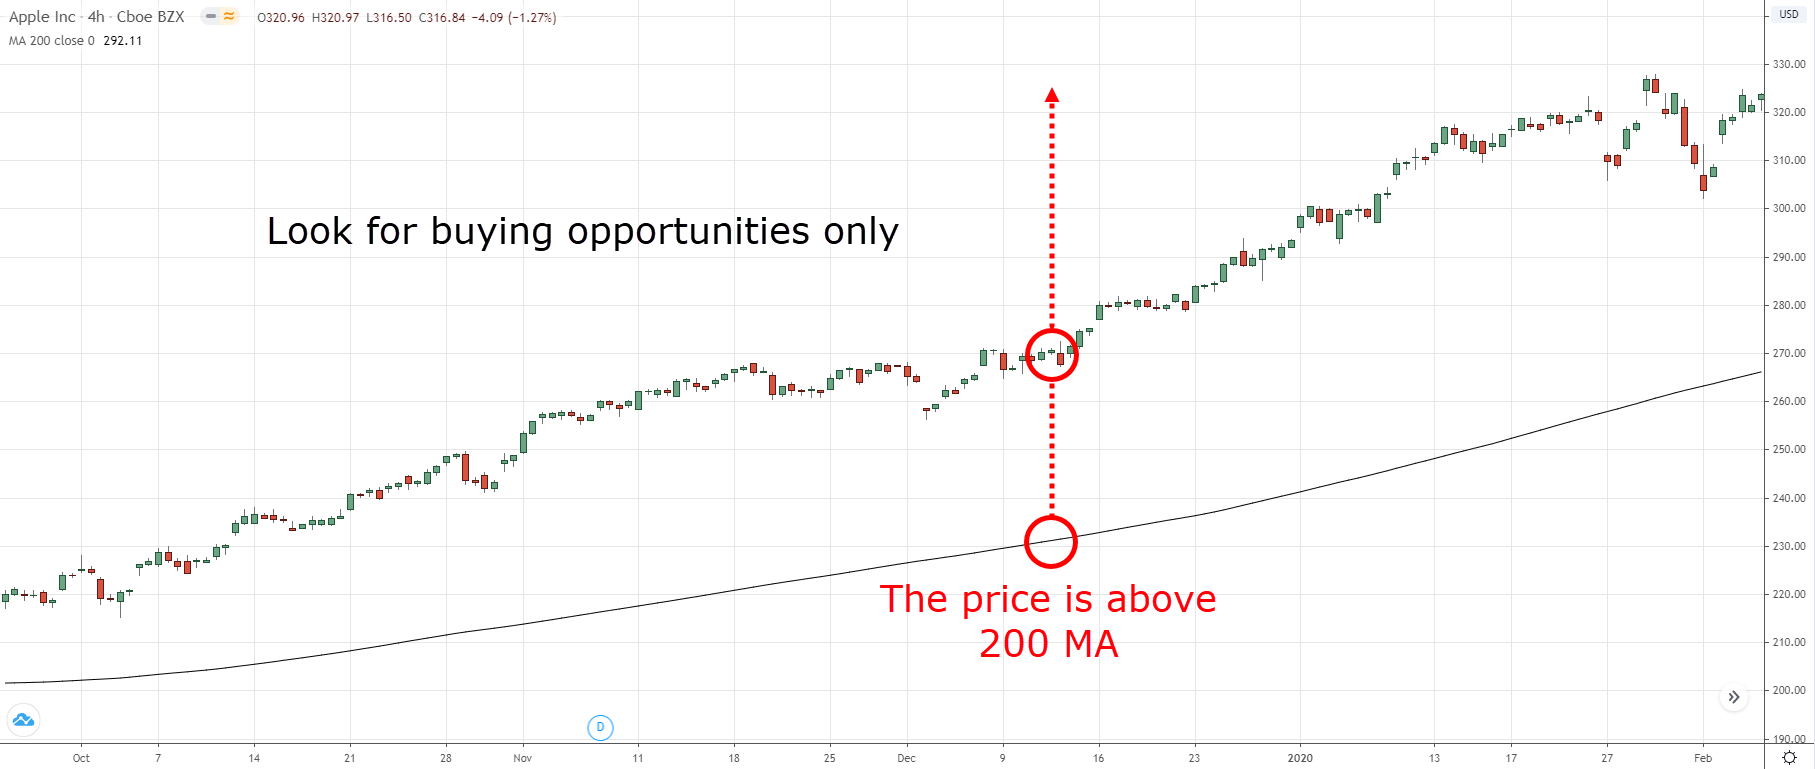
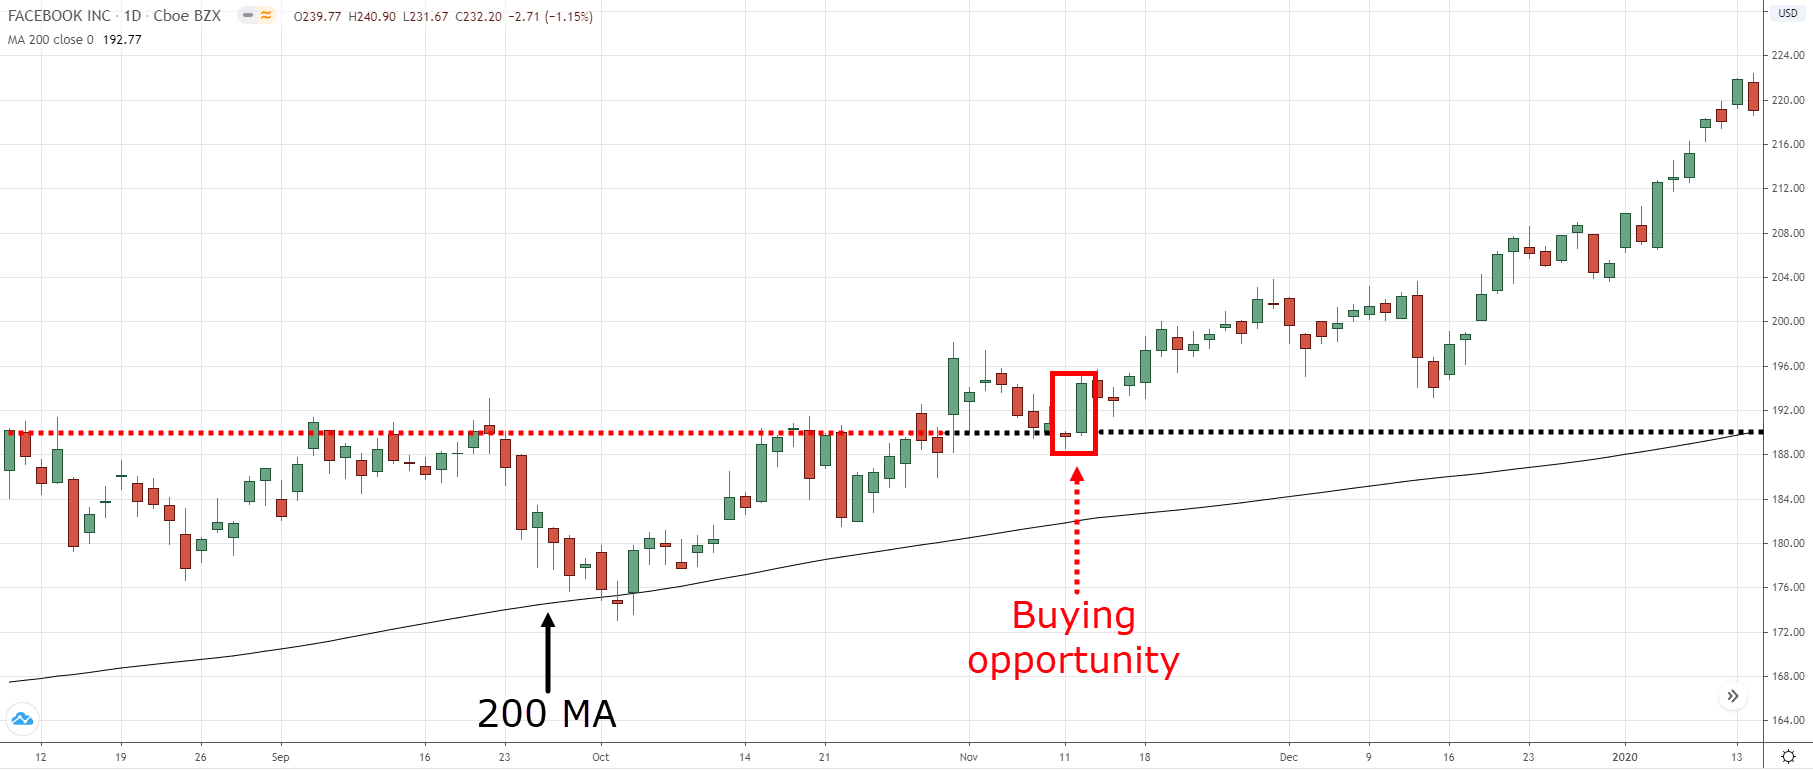
If the price is above the 200 day moving average indicator, then look for buying opportunities.
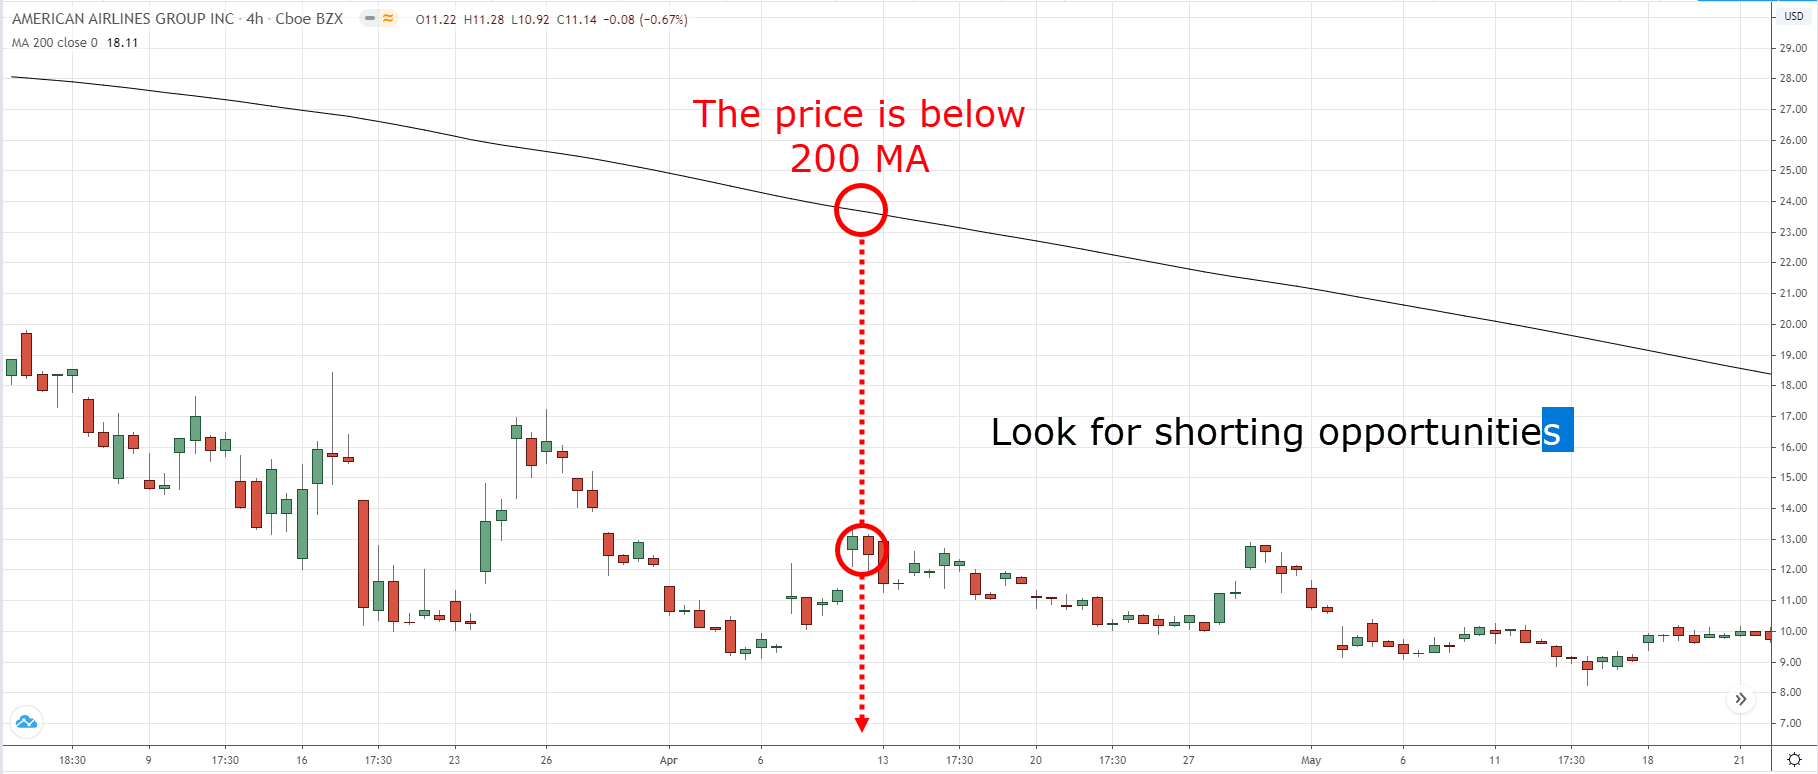
If the price is below the 200 day moving average indicator, then look for selling opportunities.
An example:
How to better time your entries when trading with the 200-day moving average indicator
You’re probably thinking:
“Okay it’s not difficult to identify the trend. But when is the right time to enter a trade?”
Here are a few techniques you can use…
1.Support and Resistance
2. 200MA bounce
3. Ascending triangle
4. Bull Flag
I’ll explain…
1. Support and Resistance
Support — an area on your chart where potential buying pressure could step in.
Resistance — an area on your chart where potential selling pressure could step in.
So, if the price is above the 200 day moving average, you can look for buying opportunities at Support.
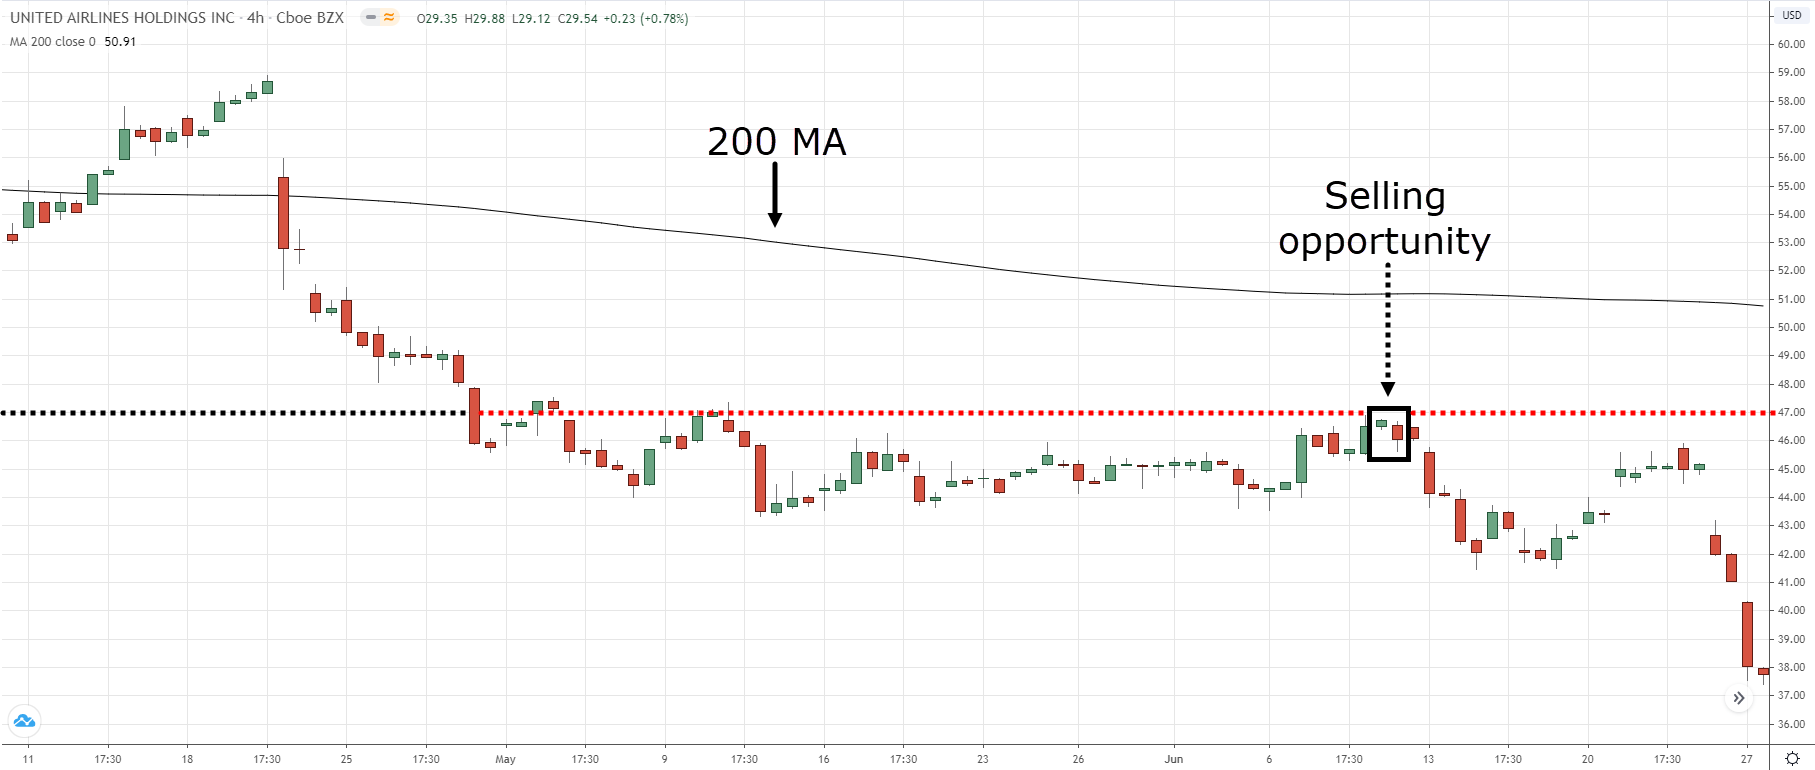
Or if the price is below it, you can look for selling opportunities at Resistance.
Here’s what I mean…
2. 200MA Bounce
In a weak trend, the 200-day moving average can act as an area of value.
You’ll notice the price approach the 200MA and then “bounce” away — and this presents an opportunity to enter the markets.
Here’s an example:
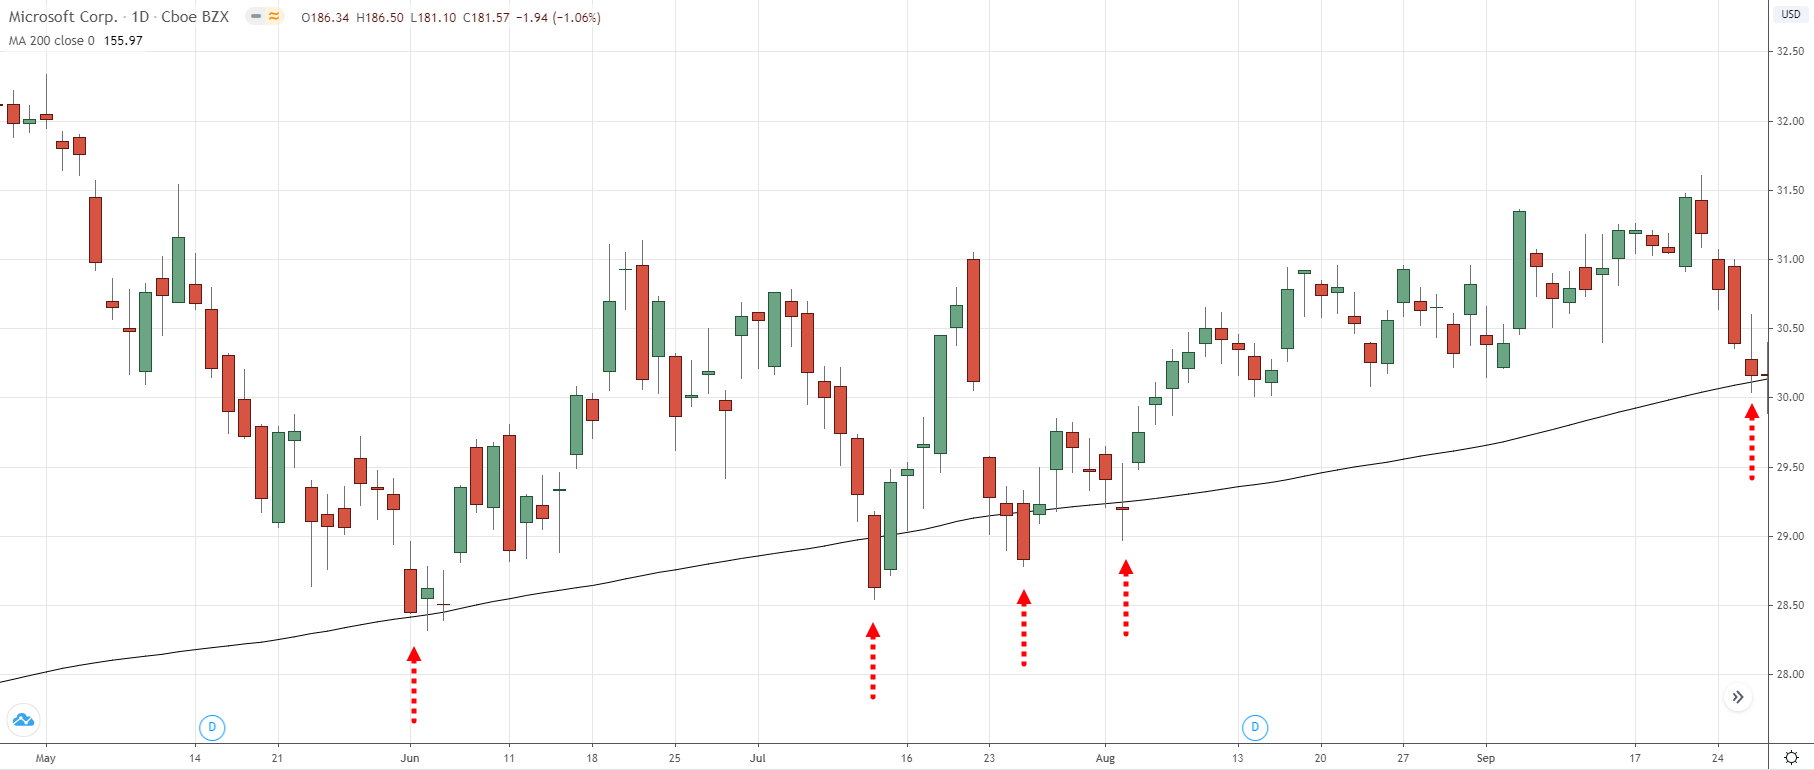
Pro Tip:
You get higher probability trades when the 200MA also coincides with nearby Support/Resistance.
3. Ascending Triangle and Descending Triangle
The Ascending Triangle is a bullish chart pattern.
It’s a sign of strength as the buyers are willing to buy at higher prices (despite coming into Resistance).
So in an uptrend (the price above 200MA), you can look for an Ascending Triangle and buy the breakout.
And in a downtrend, look for a Descending Triangle and short the breakdown.
An example:
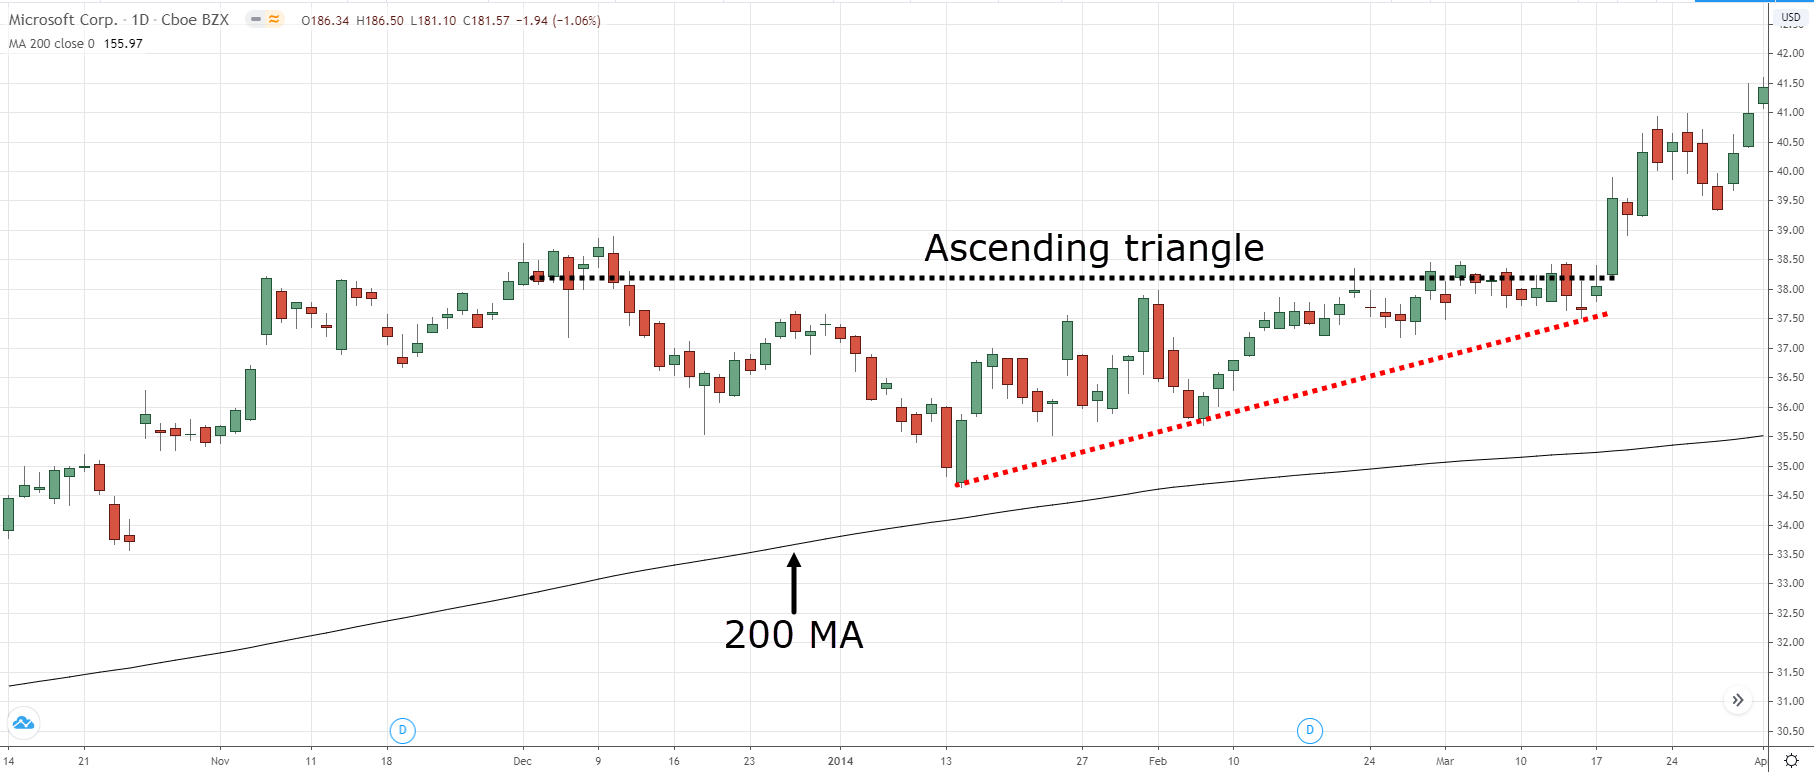
Pro Tip:
The longer the Ascending Triangle takes to form, the stronger the breakout.
4. Bull Flag
The Bull Flag is another bullish chart pattern.
It’s a sign of strength as the buyers are in control and the sellers have difficulty pushing the price lower (that’s why you have small-bodied candles on the pullback).
So in an uptrend, you can look for a Bull Flag pattern and buy the break of the highs.
And in a downtrend, look for a Bear Flag pattern and short the break of the lows.
Here’s what I mean…
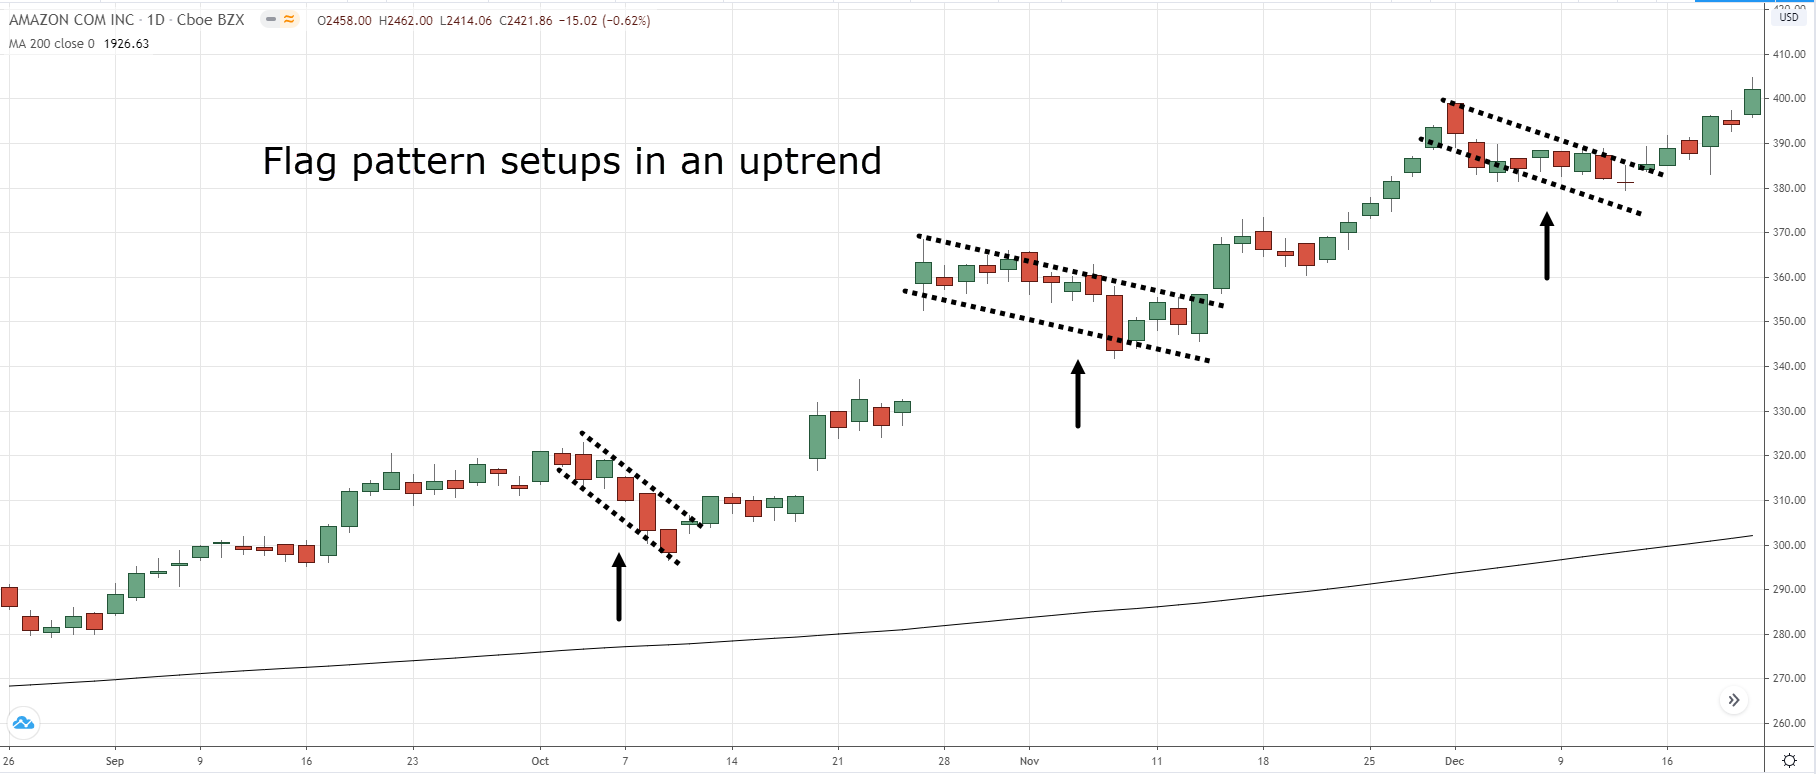
Pro Tip:
The best flag pattern to trade is when the price just broke out of a range (usually the first pullback).
200-day moving average: How to ride massive trends without getting stopped out on the retracement
Here’s a fact:
If you want to ride massive trends in the market (the kind that gets other traders drooling), then you must give your trade room to “breathe”.
Having a tight trailing stop loss won’t cut it.
Instead, you must give it a buffer.
And one way is to trail your stop loss with the 200-day moving average.
This means if you’re long, then you’ll only exit the trade when the price closes below the 200MA.
Or if you’re short, then exit the trade only when the price closes above the 200MA.
Here’s what I mean…
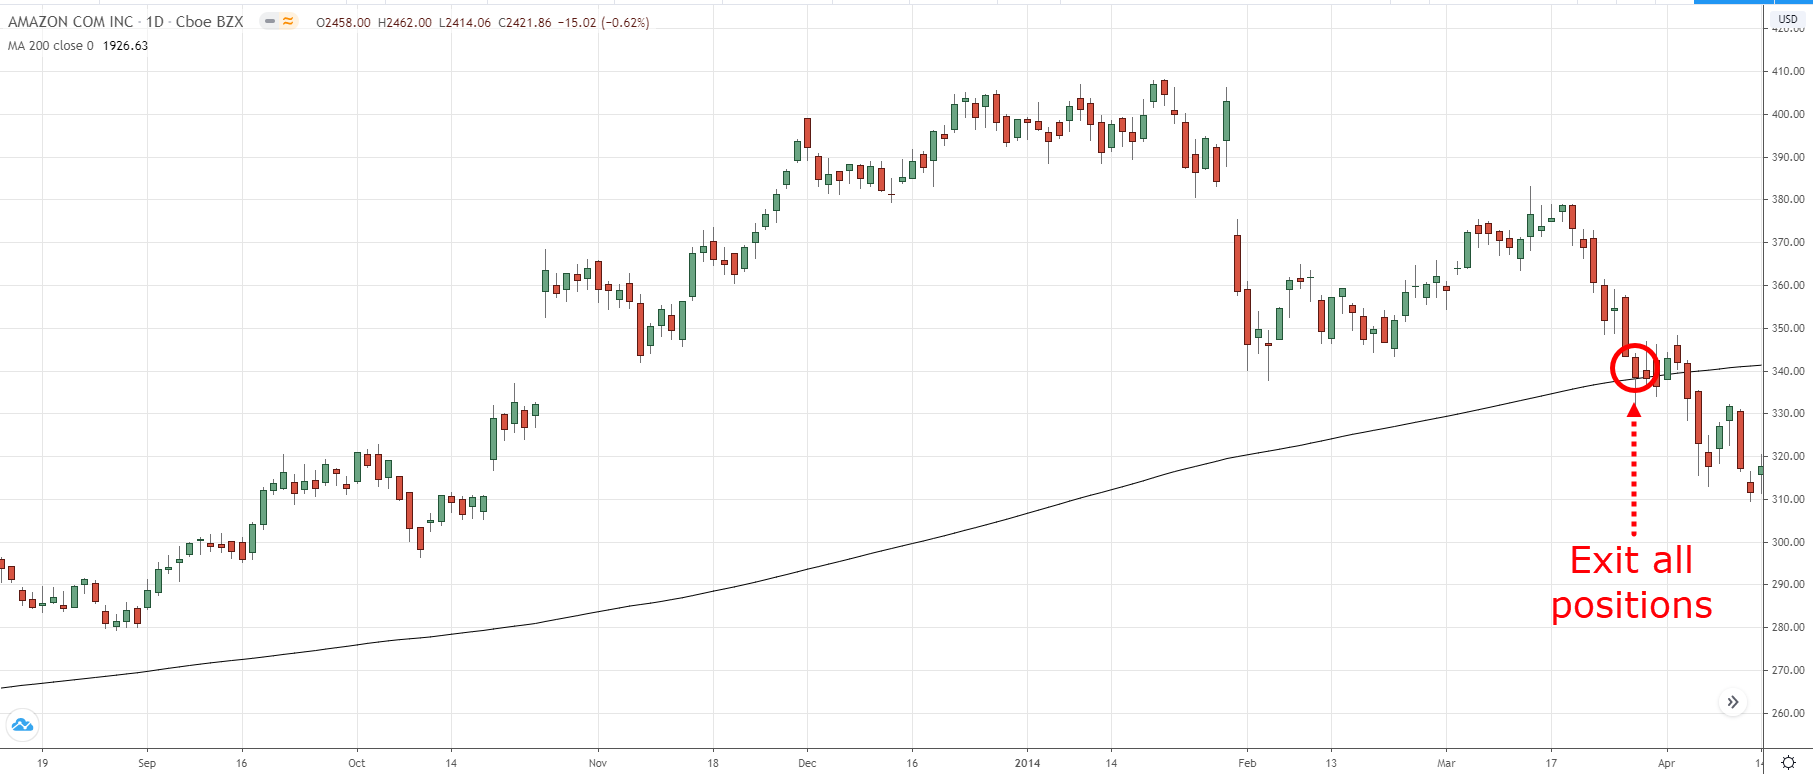
Pro Tip:
If you want to ride short-term trends, you can trail with the 20MA.
If you want to ride medium-term trends, you can trail with the 50MA.
How to identify the correct market cycle so you don’t get caught on the wrong side of the move
Here’s a fact:
The market is always changing.
It moves from a range to trend, trend to range, and etc.
You can break it down into 4 stages:
1. Accumulation
2. Advancing
3.Distribution
4. Declining
I’ll explain…
(This is important so please study it)
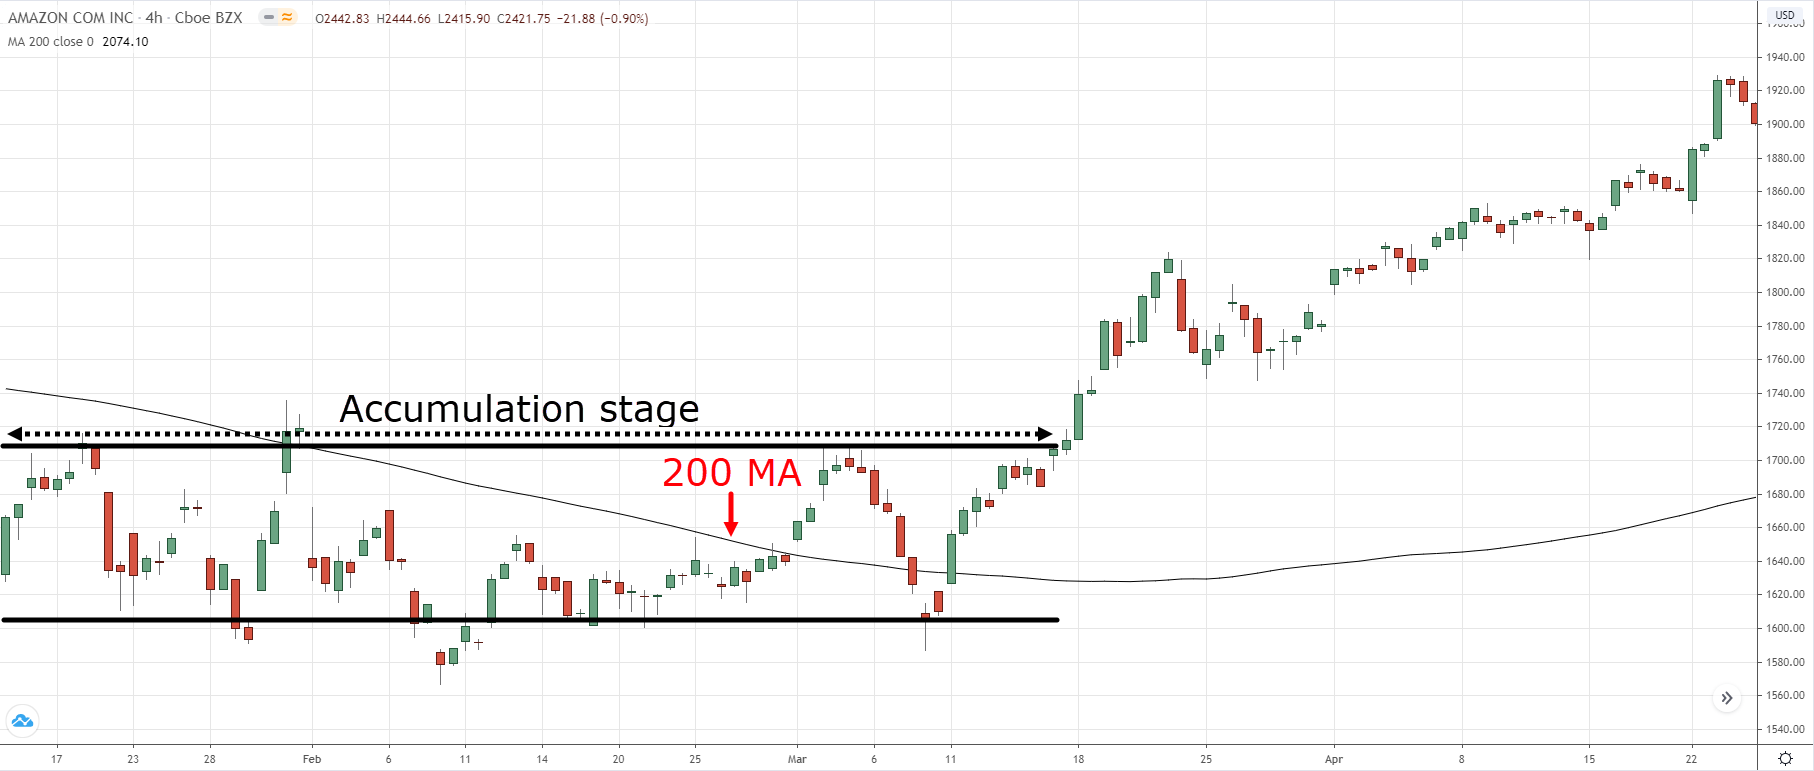
1. Accumulation stage
The accumulation stage occurs after a downtrend.
It looks like a range market with obvious Support & Resistance.
You’ll see the 200MA flatten and the price might “whipsaw” around it.
This tells you the buyer and sellers are in equilibrium and the market is undecided.
Here’s an example:
Now…
In an accumulation stage, the market could break out in either direction.
If it breaks down lower, the downtrend continues (and you can look for shorting opportunities).
But if it breaks higher, then it’s the start of an uptrend which brings us to the next stage…
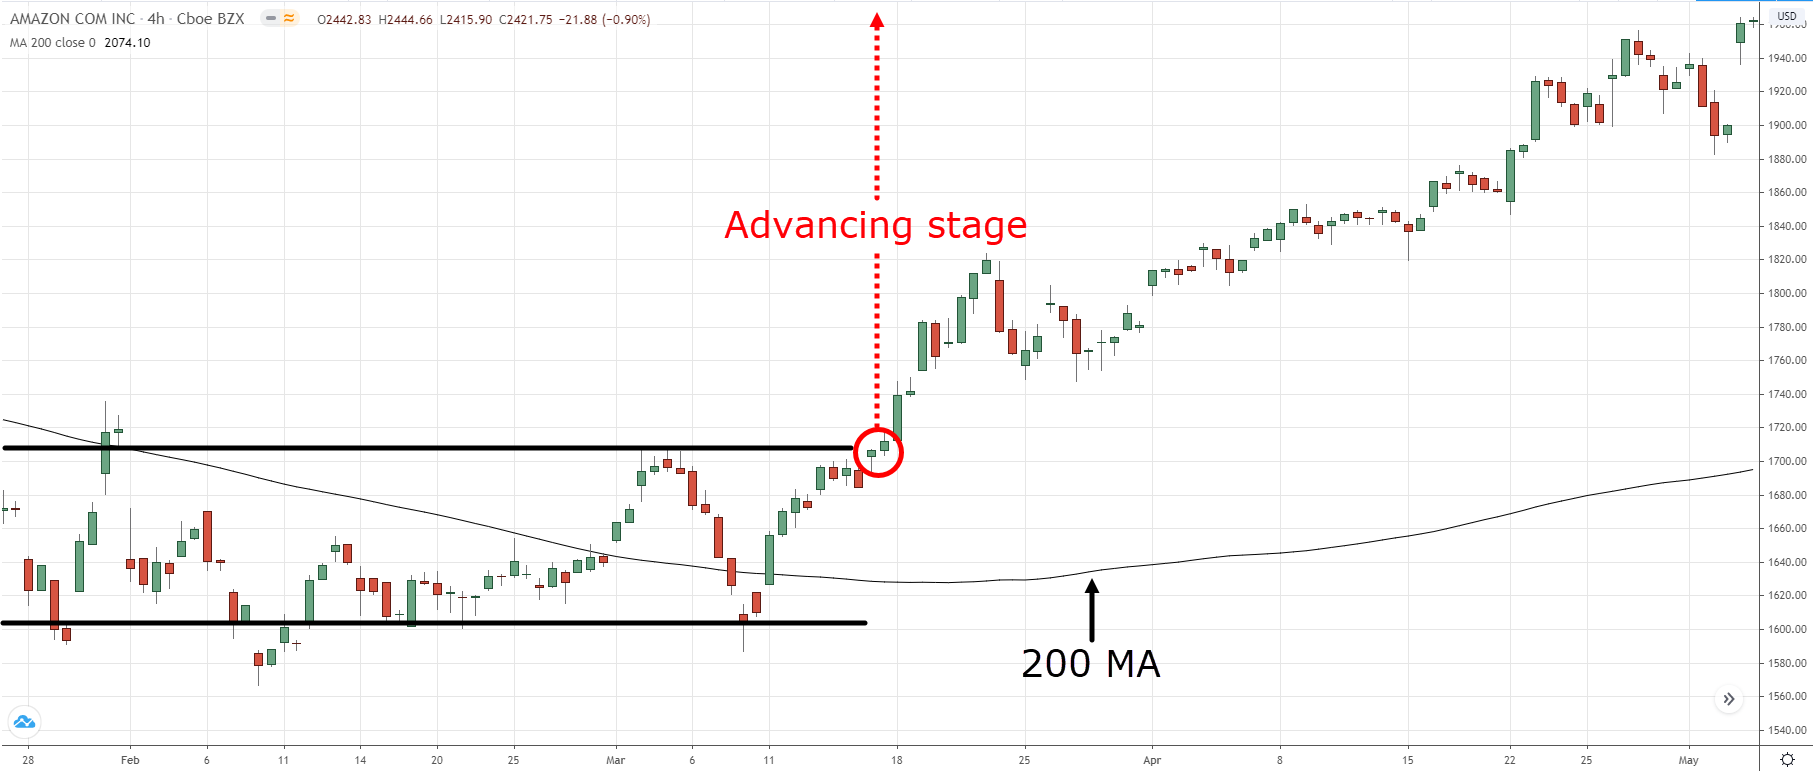
2. Advancing stage
The advancing stage occurs when the price breaks out higher of the accumulation stage.
It looks like an uptrend with higher highs and lows.
At this point, you’ll see the price above the 200MA and the 200MA starts to point higher.
Here’s an example:
Now…
In the advancing stage, the path of least resistance is towards the upside, so you want to be a buyer (not a seller).
There are a few ways you can trade the advancing stage…
- Buy the first pullback of the accumulation stage
- Wait for a pullback towards previous Resistance turned Support
- Look for a pullback towards the Moving Average
If you want to learn more, check out The Trend Trading Strategy Guide.
Next…
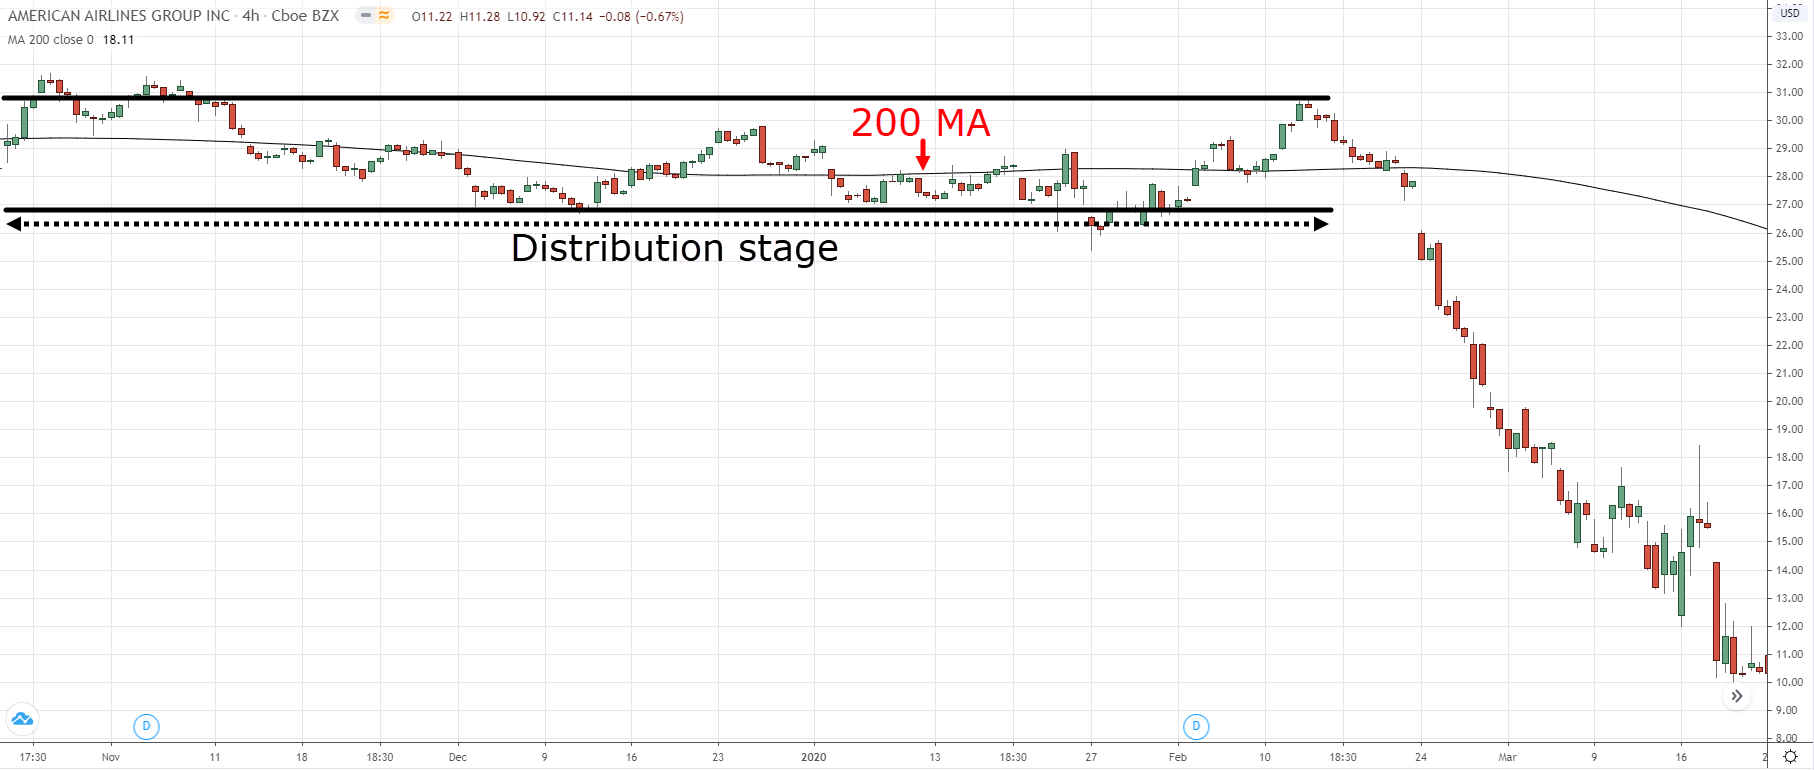
3. Distribution stage
Here’s the thing:
Markets don’t go up forever.
Eventually, sellers would come in to push the price lower.
And the first sign of weakness is in a distribution stage.
It looks like a range market in an uptrend and you’ll see the 200MA flatten and the price might “whipsaw” around it.
This tells you the buyer and sellers are in equilibrium and the market is undecided.
Here’s an example:
Now…
In a distribution stage, the market could break out in either direction.
If it breaks out higher, the uptrend continues (and you can continue to look for buying opportunities).
But if it breaks lower, then it’s the start of a downtrend which brings us to the next stage…
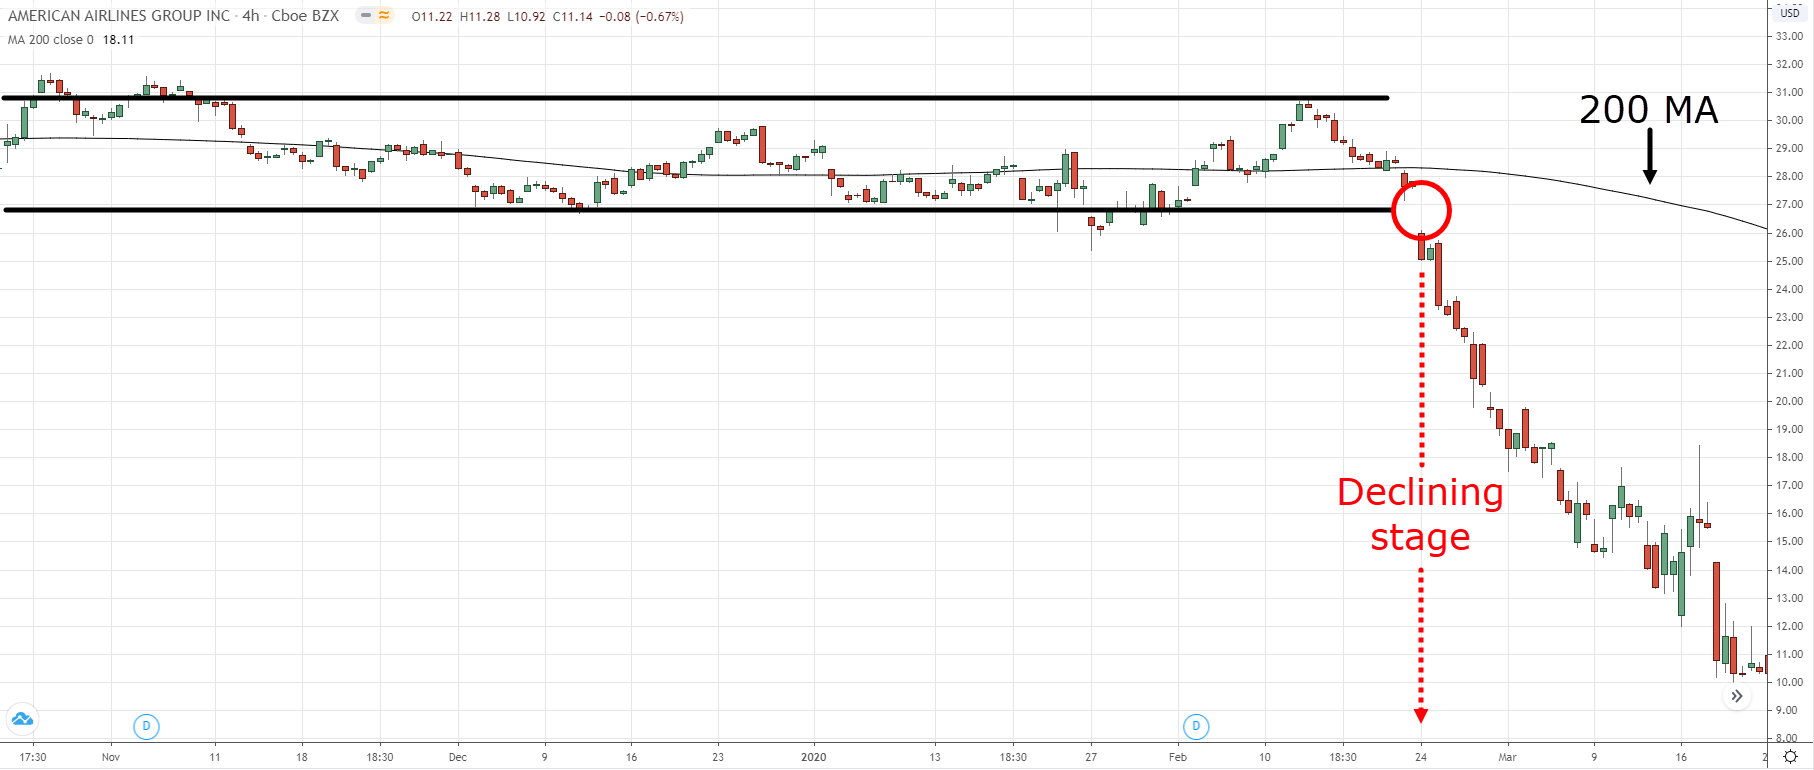
4. Declining stage
This is the final stage of the market cycle.
The declining stage occurs when the price breaks down of the distribution stage.
It looks like a downtrend with lower highs and lows.
At this point, you’ll see the price below the 200MA and the 200MA starts to point lower.
Here’s an example:
Now…
In a declining stage, the path of least resistance is towards the downside, so you want to be a seller (not a buyer).
Likewise:
A declining stage doesn’t go on forever.
It’ll come to a point where the price is low enough to attract buyers.
And that’s where the market transits back to stage 1 — the accumulation stage.
One last thing…
The 4 stages of the market is more of an art than science.
Sometimes it’s not clear which stage the market is in.
When that happens, your best bet is to move on to another market which makes more sense.
Conclusion
Here’s what you’ve learned today:
- The 200 day Moving Average (MA) is a long-term trend following indicator
- You can use the 200MA as a trend filter. Look for buying opportunities when the price is above it and selling opportunities when the price is below it
- You can time your entries by trading at Support and Resistance, Moving Average, or chart patterns
- You can trail your stop loss with 200MA and ride massive trends
- The 200MA helps you identify the 4 stages of the market so you can better time your entries and exits
Now here’s what I’d like to know…
How do you use the 200 day moving average in your trading?
Leave a comment below and share your thoughts with me.
I used it with 20MA
Awesome to know that Atah, do you use the 20MA to trail your stop loss?
Great rayner, please send these concepts again and again
More to come Ashish!
I use the 200ma to identify markets direction
Very objective!
Pls share knowledge about day trading
Thank you for the suggestion Himanshu, we’ll try to consider it!
Which time frame is better for 200 MA ?
Hey there Vinay, it doesn’t really matter which timeframe you are using it, but why and how you are using it!
But Rayner uses the 200 MA as a “trend filter” on the daily timeframe
Knowledge is power, getting much empowered but still in demo looking forward to open a live acc.
Definitely, keep on going Ann!
Hail Rayner. More of this to come. Really educating
Definitely more to come, stay tuned!
Thank you Rayner 🥂
You’re welcome, John!
How do I trail My stop using the 200 day moving average?
You can simply wait for the price to close below the 200 MA if you are on a long position!
Overall trend indicator, I’m a small account holder.
Trading between 5-15mins time frame,
So I buy when I’m above the 200MA
Good to know that you use a trend filter even though you’re trading the lower timeframe Gerston!
I use 200 MA together with 50 and 15 MA as an entry
Thanks for sharing Rudzani!
The 200ma is discussed in this article as the 200 day ma. But do these principles apply at smaller time frames: hour, 15 min, 5 min, 1min?
Hey there Paul, yes, they do!
Moving averages are basically tools that help you capture different types of trends, and trends can be different in every market and timeframe.
So in the end, it’s not about the indicator, it’s about the price itself, and what you want out of it!
Thanks for share the knowledge. It will be helpful if you share knowledge in stock options (Call and Put) trading.
You’re welcome Thiru!
Though as of now we have no content regarding options trading.
Thanks for everything you’re doing to help us. I find this very helpful as I am a beginner in trading
Thank you, Peleibaou!
Just keep it up!
Hey Rayner,
I really appreciate ur help,
I find this very helpful to me as a beginner, please keep it up.
Thank you for the kind words, John!
This is really cool I love moving averages thank you for sharing I actually combined it with my indicator and I learn to treat it shows me tops and bottoms I get my entries easier and exits I also combined it with money flow momentum money flow and moving averages I love it love your videos thank you for sharing
Awesome to hear that Aladino, you’re welcome!
Thank you very much sir.
Do we use the 200 day MA with daily time frames only? Or it goes with any time frame. Or smaller time frames smaller MOVING AVERAGES?.
Hey Stephen, yes it goes with any timeframe, the CONCEPT is for the 200-period moving average to define valid trends, so feel free to do so at a lower timeframe
Thank you Rayner
You’re welcome, Tochukwu!
Thanks Rayner.
Good and very clear explanation how to use MA200.😊
You’re welcome, Naim
Great to hear that!
God bless you my mentor… More grace sir….am combining the 200ma and stochastic indicator
Great idea, Takim!
This is perfect I really love it
Awesome to hear that Dominic!
Thank you for the information, learnt something new today.
Great to hear that Bongkile, you’re welcome!
all nicely described. i use the 200 ma and 50 ma for entering the trend. this together with the key levels and the volume currently being traded.
Sounds like a great plan Jurgen, let us know how it works out!
I will use the 200MA to track the market conditions and identify areas of value with it.
I will never sell when the price is above the 200MA or never buy when price is below it. I will also it in collaboration with SNR lines, trend lines, and chart pattern to find perfect entries.
Thank you for sharing, Okolai!
To indicate market direction
Great!
Thank you, Rayner, really you’re my role model in this trading journey. and I would like to ask if 200 MA in a ranging market is effective, and how it behaves in that market.
Thank you for the kind words Olivier!
Moving Averages are a trending indicator, so, obviously, its weakness lies on ranging markets.
You can, however, know it’s ACTUALLY a ranging market when the price is moving back-and-forth the 200 MA (an objective way to define ranging markets)
Very clear and to the point. Thanks Rayner.
You’re welcome, Edwin!
Hy
Thanks you for supporting.Am happy to meet your side
You’re welcome, Abdulrahaman!
How to use it in trading
The presentation provided a better understanding and better picture of the market….a great help and productive learning process!!!!
Great to hear that , Romulo!
Many thanks Rayner, I appreciate what you are giving of information over years, I personally have a little knowledge about 200MA before this guide but after learning it, I found it a very useful tool to ride massive trends, I liked your style of learning Rayner, I read all of your emails, posts, and guides,
Thank you!
Hey Muhammed, we’re delighted to hear that!
May you keep on learning, Muhammed!
Very good information regarding 200 moving average for long term investment buy and sell
Thank you, Narendra!
Thanks for the light you shared here! you are a God sent.. your break everything down like break fast! Thank you Rayner🙏🏽 Your Teaches always sink deep inside my head. I feel good right.
You’re welcome, Victor!
Thank you for the kind words!
I use the 200 MA for market trend direction.
Great, thanks for sharing, Giddel!
Honestly Rayner I used to consider myself as dullard which always makes me think I can’t trade this forex market. Because since when I started I’ve been losing money on trading and uses almost my time exercising on demo I read a lot of free books online but still a failure at the end. But the glory now is that I use to read from your articles also and to be sincere with my stories I think a changes is now appearing like miracles all the information I do get from all the ebooks articles. My efforts and dedication are now looking real. I do appreciate and grateful I can follow the trend now.
Great to hear that and congratulations Bayo, keep it up!
Every time I read your email I especially like your strategy. It’s like I’m hoping to win the market. I hope you will always send me your strategy my friend.
We will continue to do so, more strategies on the way, Ronald!
Knowledge is powerful!!!
Thank you sir for sharing great knowledge
God bless you sir
You’re welcome, Oguche!
All your teachings are very helpful. They have help me to cut my loses and also to understand the market movements as well.
I will stick to you guides until i become a profitable trader.
Awesome to hear that, Robert
Make sure you also continue to refine your strategy beyond what we teach, good luck!